The Tampa Bay Florida office market saw slow gains in the second quarter of 2012, with leasing activity edging up. While there was no swift rebound, vacancy rates declined from the previous quarter and year. Rental rates remained flat or down slightly in the first half of the year. Leasing activity is expected to remain steady in the second half, though not at a significant level as many businesses have adopted a wait-and-see approach locally and nationally.
The Tampa Bay office market saw negative absorption of 350,754 square feet in Q3 2012, though numerous small and large leases were signed that will impact absorption in the next two quarters. Vacancy rates increased slightly to 16.0% overall and 15.7% for Class A buildings. Several developments are in the planning stages, with SouthGate, a 400,000 square foot LEED building, currently in pre-leasing. The market outlook for 2013 is positive as employment continues to increase in the region.
Tampa Bay Office Market Report - Q4 2011Jeff Tolrud
Ìý
The Tampa Bay office market showed signs of improvement in Q4 2011. Net absorption was positive as vacancy rates declined. While overall rental rates remained steady, certain submarkets saw increases. The job market grew in sectors like healthcare and technology, lowering the unemployment rate. Investor interest in the market is expected to continue growing through 2012.
North American Office highlights 2Q 2012Coy Davidson
Ìý
The office market in North America saw slowing growth in the second quarter of 2012. Key indicators like absorption, vacancy rates, and sales volumes improved but at a slower pace than in 2011. Office transaction activity declined compared to the previous year. Intellectual capital, energy, and education (ICEE) markets continued to see strong demand and lower vacancy rates. While absorption remained positive, it was shrinking compared to the prior period. The average vacancy rate for the U.S. dipped below 15% for the first time in years, though new construction means it may be difficult for the rate to fall below 14% in the near future. Delinquency rates for commercial mortgage backed securities loans on office properties set new records.
The Tampa Bay office market saw a slight increase in vacancy rates in Q1 2012. Net absorption was negative as the Gateway submarket vacated nearly 75,000 square feet. Rental rates remained relatively flat, with Westshore commanding the highest rates. Investment activity was quiet for Class A buildings, while some medical and smaller office sales occurred. New construction may begin later in 2012, including two large projects in downtown Tampa and Westshore totaling nearly 1.2 million square feet.
office space toronto, toronto office space, office search toronto, office space in toronto, office rentals toronto, commercial office space, commercial real estate toronto, office rent toronto, toronto offices for lease
Tampa Bay Office Market Report - Q3 2011Jeff Tolrud
Ìý
- The Tampa Bay office market showed signs of stabilization in Q3 2011, with positive net absorption for the year and declining vacancy rates.
- Class A office space saw the largest increase in net absorption as tenants took advantage of higher quality space at lower overall costs.
- While average asking rental rates continued to fall and excess supply remains, several positive trends emerged including declines in overall and Class A vacancy rates across most submarkets. Further employment growth will be needed to sustain a recovery.
The Puget Sound office market continued to strengthen in Q3 2012, with declining vacancy rates and increasing rental rates. Employment growth at tech companies like Amazon fueled a drop in vacancy to 15.6% while average direct rents rose to $28.63/SF. Several large investment sales occurred, including Amazon's planned $1.16 billion purchase of its Seattle headquarters. Absorption was positive at 342,411 SF, bringing the YTD total to over 2 million SF. The market forecast calls for further declines in vacancy and rental rate growth, especially for quality Class A space downtown.
Parking rates in most North American cities saw little change from 2010 to 2011. Daily parking rates increased slightly by 0.8% while monthly rates decreased by 0.2%. Despite economic improvements, parking operators did not significantly raise rates to provide relief for businesses and consumers facing higher gas prices. Rates are expected to rise modestly in the coming year as economic recovery continues.
The vacancy rate for rental apartments in Halifax, Nova Scotia declined for the second year in a row to 2.6% in 2010. While vacancy rates increased in some submarkets of Halifax and Dartmouth, the major rental markets saw declines in vacancies. Average rents across the city increased 2.9% in 2010, with the highest rents found in newer buildings and larger units. The rental market is expected to remain stable in 2011, with increasing supply from new developments balancing steady demand.
C&W - MONTREAL OFFICE MARKETBEAT - Q4 2012 Guy Masse
Ìý
The Montreal office market saw slowing growth in Q4 2012, with overall absorption dropping slightly to -15,000 square feet due to large blocks of vacant space returning to the market. However, vacancy rates remained steady at 7.7% overall and 6.7% direct. Suburban office markets performed better than the downtown core, with over 160,000 square feet of positive absorption offsetting increased vacancies downtown. Looking ahead, nearly 750,000 square feet of new downtown construction is expected to alleviate class A space shortages while stable rental rates and expanding suburban options will boost future leasing activity.
The document summarizes key achievements and operational performance for TIM in 2011. Some highlights include:
- TIM became the #2 player in Brazil in terms of value and volume, with a market share of 26.5% and customer base growth of 25.6% YoY.
- EBITDA grew 10.4% YoY to R$4.6 billion in 2011, with an EBITDA margin of 27.1%. Voice revenues and data revenues grew significantly.
- Network investments increased 2G capacity by 43% and expanded 3G coverage to 67% of the urban population, while reducing commercial capex.
The document summarizes the office market in Metro Detroit and Washtenaw County for Q4 2011. It reports that vacancy rates remained stable at 19.5% in the Metro Detroit area. Net absorption was positive 297,451 square feet for Q4 2011, while rental rates slightly decreased to $18.15 per square foot. The market is believed to be close to bottoming out with stable vacancy levels throughout 2011 and absorption of existing space continuing as new construction remains low.
The Las Vegas office market continues to show signs of recovery in Q4 2011. Vacancy rates remained stable at 23.8% while direct net absorption was positive for the full year after being negative since 2008. Rents have stabilized after declining but remain lower than past rates. Absorption was positive for Class B and A properties while Class C saw negative absorption. The outlook expects further improvement in 2012 with lower vacancy and slightly higher rents dependent on continued job growth and economic stability in the region.
At March's Member Meeting, Dwight Bassett, Economic Development Officer for the Town of Chapel Hill, spoke about current issues that face all of us as residents, Brokers, consumers, and businesses.
The document provides a summary of commercial real estate activity in San Francisco for the first quarter of 2010. It includes data on office leasing activity such as major leases signed, sublease space absorbed, and vacancy rates by neighborhood. It also summarizes significant building sales, projects under construction, and large developments planned. Overall, the San Francisco office market saw a net loss of space absorbed in Q1 2010, with vacancy increasing slightly, though leasing velocity and asking rents stabilized in many areas.
The Columbus office market gained 195,000 square feet of positive absorption in Q3 2011, marking the second consecutive quarter of growth. Vacancy rates decreased slightly to 12.8% from 13.0% in the previous quarter. Notable leasing activity included JP Morgan Chase filling 72,588 square feet at 1000 Polaris Parkway. Construction continued on projects such as NetJets' 140,000-square-foot building and Water's Edge II in New Albany. The unemployment rate in Columbus remained steady at 8.2% in July.
Houston's strong job growth and healthy economy drove increased office leasing activity and positive absorption in 2012. Absorption reached 4.4 million square feet for the year as the vacancy rate declined to 13.8% and rental rates rose nearly 8% citywide. Continued expansion in the energy industry is fueling demand for new office space development with over 4.2 million square feet currently under construction.
This document provides selected consolidated financial data for Barnes & Noble, Inc. for fiscal years 2001 through 1997. In fiscal 2001, total sales were $4.87 billion, with Barnes & Noble store sales of $3.36 billion and GameStop store sales of $1.12 billion. Gross profit was $1.31 billion and selling and administrative expenses were $904.28 million.
Local lawyer wants alleged police brutality victim prosecuted for perjury. A lawyer is calling for a man who accused police of brutality to be prosecuted for perjury. Heavy rain continues to fall in the region and more rain is expected through the week. Independent truckers who transport cargo to and from the ports of Los Angeles and Long Beach spoke about poor working conditions and low pay at their job.
The office market in Tampa Bay, Florida continued to see positive absorption in Q4 2012. Vacancy rates fell from the previous quarter for both overall and Class A properties. Investment sales increased in December 2012 and several large Class A office buildings traded hands. The market outlook remains positive with continued absorption expected in the first half of 2013, particularly for mid-sized spaces, though concessions may increase for Class B properties.
- The office vacancy rate increased to 15.9% in Q2 2009, up from 15.2% in Q1 2009, as new completions outpaced absorption of occupied space. This marks the sixth consecutive quarter of declining occupied space.
- Asking rents fell 1.4% and effective rents fell 2.7% in Q2 2009, the largest declines since the first half of 2002 during the economic impact of 9/11. Continued weakness in labor markets suggests limited upside in the near term.
- The national trends indicate the office market remains under pressure with high vacancy rates and falling rents, though the pace of declining occupied space may slow in the second half of the year if stabilization occurs.
This document summarizes the Houston office market in Q1 2011. It finds that vacancy rates decreased slightly while rental rates continued to decline. Net absorption was positive, driven primarily by renewals taking advantage of lower lease rates. The suburban market outperformed the central business district, though an influx of new vacant space in 2011 could add softness downtown. Job and economic growth remain key to absorbing existing and future office space supply.
Las Vegas Americas Market Beat Industrial Q42011Jessica Parrish
Ìý
The document provides an economic and market snapshot of the industrial real estate sector in Las Vegas, Nevada for Q4 2011. Key points include: vacancy rates remained stable at 15.1% overall; direct net absorption ended the year positive for the first time since 2008; median asking rental rates ranged from $0.35 to $0.52 per square foot per month; and the outlook expects continued modest economic improvement in 2012-2013 dependent on job growth.
The Las Vegas office market saw improvements in Q2 2012, with vacancy rates declining and positive net absorption. Vacancy fell to 23.9% from 24.4% in Q1, while net absorption was 286,291 sf after negative absorption last quarter. Average asking lease rates continued falling, now at $1.84 psf/FSG, the lowest in 12 years. The outlook remains positive as vacancy rates are expected to remain stable for the rest of the year with a potential small increase in Q3, while lease rates may start rising again in the coming quarters dependent on continued job and economic growth.
North American Office Highlights 2Q 2011Coy Davidson
Ìý
The U.S. office market saw a modest rebound in Q2 with higher demand and slightly lower vacancy compared to Q1. However, the recovery remains subdued as rents continued to decline slightly. The Canadian office market performed better with stronger economic and job growth. While the U.S. and Canadian economies are projected to improve in the second half of 2011, forecasts made earlier in the year now appear overly optimistic given recent weak job numbers and high energy costs, which could dampen corporate expansion plans.
The Houston office market posted positive net absorption of 81,091 square feet in Q2 2011, with most absorption occurring in the suburban sector. Overall vacancy rates decreased slightly to 15.9% from 16.5% year-over-year. Rental rates continued to decline, with the average citywide rate dropping to $22.70 per square foot in Q2 2011. Vacancy increased in the CBD Class A properties to 12.5% while declining in the suburban Class A properties to 16.2%.
Studley Report for South Florida 3Q2012Chris Lovell
Ìý
The South Florida office market saw a decline in leasing activity in Q3 2012, with overall leasing down 13.2% from the previous quarter. Availability rates continued to decline modestly, with the overall rate falling to 22.0% and the Class A rate declining to 23.9%. Rents remained largely unchanged, with overall rents at $27.12/sf and Class A rents at $31.18/sf. The economy and upcoming election were causing businesses to be cautious, slowing leasing activity. Large blocks of space continued to decline in availability in major submarkets.
Studley report for south florida 4 q12Chris Lovell
Ìý
South Florida's office market saw some signs of improvement in 2012 but is still bouncing along the bottom. While sectors like tourism and retail recovered slightly, the job market remains weak with office-using employment growing only 1% compared to nearly 2% nationally. Availability rates increased slightly to 22.2% overall as new buildings delivered space faster than it could be absorbed. Rents decreased slightly and concessions remained common as competition for tenants remained intense due to oversupply. The recovery is uneven across submarkets, with higher-quality buildings in places like Coral Gables performing better while older properties struggle.
This document provides a retail market report for the third quarter of 2011 in the Greater Columbus region. Some key points:
- The retail vacancy rate has steadily decreased to 11.2% due to leasing and new retail space completions. Net absorption was positive 118,454 square feet.
- Notable new retail developments include a 44,000 square foot movie theater and 55,000 square foot hobby store in Grove City, and plans for 40,000 additional square feet at New Market Mall.
- Average asking rental rates decreased across strip centers, neighborhood, and community centers this quarter, possibly due to softer demand or rates better reflecting current leasing rates.
- Total market activity volume was 500
Three new office buildings were completed in Q3 2009, increasing the total office supply in Hanoi to 493,000 square metres. Demand for grade A and B offices rebounded due to signs of economic recovery, but new businesses remained cautious. The hotel market saw a slight decrease in demand during Q3 2009 due to fewer international visitors. Over 1,000 new hotel rooms are expected to be added by 2010, located primarily in the western suburbs. The retail market saw new supply of nearly 15,000 square metres from the Vincom Galleries shopping centre. Future retail supply of approximately 82,000 square metres is expected by 2010 with the completion of several major projects.
The Houston office market report summarizes Q3 2010 market conditions. While leasing activity increased, vacancy rates rose slightly citywide. The suburban office market continued to outperform the central business district, with positive net absorption compared to negative absorption in the CBD. Rental rates for Class A space decreased slightly in the CBD but remained stable in the suburbs. Several large leases signed in the quarter signal a possible improvement in demand, but new construction completions may offset absorption gains. The outlook remains cautious as economic uncertainty could limit leasing activity through year-end.
This report used in the May 15th Prophecy post titled "May 15th Prophecy Another Year In Review, What Is Now?"
http://lastdaywatchers.blogspot.com/2009/05/may-15th-prophecy-another-year-in.html
Houston's office market saw positive net absorption in Q4 2010, with vacancy rates decreasing slightly from the previous year. While overall absorption increased, tenants benefited from declining average CBD rental rates for Class A buildings. Looking ahead, over 1 million square feet of new Class A space is scheduled to come online in 2011, adding to vacancy levels, but job growth in Houston remained positive.
- Cap rates for net leased retail properties declined 25 basis points in Q4 2012 while rates for office and industrial properties rose slightly. Retail properties have a 75 basis point premium over other sectors due to limited supply.
- The supply of net leased properties declined 14.4% in Q4 due to a lack of new construction and tenants occupying existing space. This scarcity has compressed cap rates further, especially for properties occupied by investment grade tenants like FedEx, McDonald's, and AutoZone.
- Transaction volume is expected to be up 5-14% in 2013 as demand remains high for core assets with strong tenants, maintaining low cap rates. However, limited supply may push investors to seek shorter-term leased properties
The Metro Detroit office market saw slight improvements in the fourth quarter of 2010. Net absorption was positive 924,996 square feet and vacancy rates decreased to 19%. Rental rates increased slightly to $18.77 per square foot. Construction remains low as the real estate market continues to recover from the economic downturn. Challenges remain for commercial property owners as high vacancies persist through 2011.
Green Building Index Profile Report: Midtown NYscottbrooker
Ìý
The document provides an overview of green building and office market conditions in Midtown Manhattan, New York. It finds that while the Midtown office market vacancy rate increased significantly in 2009, signs of stability emerged in the second half of the year. It also reports that Midtown Manhattan ranked third in a green building opportunity index due to forecasted rent and job growth, though new supply may impact vacancy. Finally, it notes that Midtown leads New York in adopting and implementing LEED strategies in commercial buildings.
- The overall vacancy rate in the Las Vegas office market decreased slightly from 23.46% to 23.28%.
- Developers have halted new development due to high vacancy rates, limited financing, and reduced tenant demand.
- Average asking rental rates decreased from $2.00 per square foot to $1.95 per square foot.
- Net absorption was positive for the first time since 2008, indicating signs of market stabilization.
The Houston office market saw positive absorption, falling vacancy rates, and rising rental rates in the past year. Demand for office space from the energy sector expansion has spurred new construction projects. Citywide vacancy decreased from 15.9% to 14.6% over the past year while average rental rates increased from $22.81 to $23.56 per square foot. In particular, Class A suburban office vacancy dropped from 16.6% to 14.4% and rental rates there increased 5.5% to $28.86 per square foot.
While Atlanta's office vacancy rates remain high around 19-20% and rental rates have leveled off, the biggest submarket of Buckhead is experiencing positive absorption due to companies moving to more desirable areas with reduced costs. Major transactions in the second quarter included several lease and renewal deals for office spaces over 20,000 square feet. The lack of new office construction in the city and Georgia's continued high unemployment rate are also influencing the tenant's market.
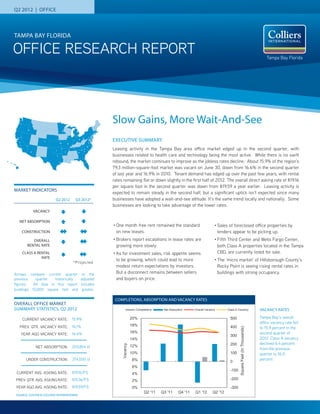
1. Q2 2012 | OFFICE
TAMPA BAY FLORIDA
OFFICE RESEARCH REPORT Tampa Bay Florida
Slow Gains, More Wait-And-See
EXECUTIVE SUMMARY
Leasing activity in the Tampa Bay area office market edged up in the second quarter, with
businesses related to health care and technology being the most active. While there is no swift
rebound, the market continues to improve as the jobless rates decline. About 15.9% of the region’s
79.3 million-square-foot market was vacant on June 30, down from 16.6% in the second quarter
of last year and 16.9% in 2010. Tenant demand has edged up over the past few years, with rental
rates remaining flat or down slightly in the first half of 2012. The overall direct asking rate of $19.16
per square foot in the second quarter was down from $19.59 a year earlier. Leasing activity is
MARKET INDICATORS
expected to remain steady in the second half, but a significant uptick isn’t expected since many
Q2 2012 Q3 2012* businesses have adopted a wait-and-see attitude. It’s the same trend locally and nationally. Some
businesses are looking to take advantage of the lower rates.
VACANCY
NET ABSORPTION
• One month free rent remained the standard • Sales of foreclosed office properties by
CONSTRUCTION on new leases. lenders appear to be picking up.
OVERALL • Brokers report escalations in lease rates are • Fifth Third Center and Wells Fargo Center,
RENTAL RATE growing more slowly. both Class A properties located in the Tampa
CLASS A RENTAL • As for investment sales, risk appetite seems CBD, are currently listed for sale.
RATE
to be growing, which could lead to more • The ‘micro market’ of Hillsborough County’s
*Projected
modest return expectations by investors. Rocky Point is seeing rising rental rates in
Arrows compare current quarter to the But a disconnect remains between sellers buildings with strong occupancy.
previous quarter historically adjusted and buyers on price.
figures. All data in this report includes
buildings 10,000 square feet and greater.
COMPLETIONS, ABSORPTION AND VACANCY RATES
OVERALL OFFICE MARKET
SUMMARY STATISTICS, Q2 2012 Completions Net Absorption Overall Vacancy Class A Vacancy VACANCY RATES
CURRENT VACANCY RATE: 15.9% 20% 500 Tampa Bay’s overall
office vacancy rate fell
PREV. QTR. VACANCY RATE: 16.1% 18% 400
Square Feet (In Thousands)
to 15.9 percent in the
YEAR AGO VACANCY RATE: 16.6% 16% second quarter of
300
14% 2012. Class A vacancy
200 declined 6.4 percent
Vacancy
NET ABSORPTION: 203,854 sf 12%
from the previous
10% 100 quarter to 16.0
UNDER CONSTRUCTION: 374,000 sf 8% percent.
0
6%
-100
CURRENT AVG. ASKING RATE: $19.16/FS 4%
PREV. QTR. AVG. ASKING RATE: $19.36/FS 2% -200
YEAR AGO AVG. ASKING RATE: $19.59/FS 0% -300
Q2 '11 Q3 '11 Q4 '11 Q1 '12 Q2 '12
SOURCE: COSTAR & COLLIERS INTERNATIONAL
2. RESEARCH REPORT | Q2 2012 | OFFICE | COLLIERS INTERNATIONAL TAMPA BAY FLORIDA
In the Bay area, seven companies are reportedly About 15.2% of Westshore’s 15.5 million square
UNEMPLOYMENT TRENDS
shopping for a combined square footage of 1 feet was vacant on June 30, compared to
million square feet. Three want large blocks of 17.9% in the same period last year and 19.9%
Florida Tampa MSA USA
space, between 80,000 square feet to 100,000 two years ago. Both submarkets saw a small
14
square feet, in build-to-suit deals. Developers increase in occupied space in the first half of
are competing for their business, with the the year. About 24,000 square feet downtown
12
transactions not expected to close for another and 61,000 square feet in Westshore.
10 12 to 24 months. Health care companies,
including call centers tied to the medical
INVESTMENT SALE ACTIVITY
8 industry, were the biggest driver in the local
office market. In the first half of the year, BMD Management purchased a 80,445 square
6 WellCare Health Plans Inc. leased 66,000 foot class A office facility located at 13577
square feet at Premier Corporate Center, 3928 Feather Sound Drive in Clearwater for $9.525
4
Premier North Drive, in Carrollwood. million ($118 psf) from Highwoods Properties.
The building was sold at a 9.5 percent cap rate
2
VACANCY INCHES DOWNWARD and was 98.8 percent leased at the time of
0
purchase. The building had last sold in October
Supply still outweighs demand in the region’s
May-07
May-08
May-09
Nov-10
Nov-11
May-10
May-11
May-12
Nov-07
Nov-08
Nov-09
1997 for $8 million.
two most desirable office submarkets –
Watermark 5 and Watermark 7, located in the
Westshore and downtown Tampa. But vacancy
Westshore submarket, were both sold to
The Tampa Bay MSA unemployment rate rates in both submarkets were lower than two
Empire Solutions for $3.75 million ($70 psf)
posted 8.6 percent in May 2012, which years ago and appear to be trending downward.
from Marketview Properties III, LLC. The two
represents a 19 percent decrease from May
Downtown Tampa’s overall vacancy rate of building combined measure 53,867 square feet
2011. The State of Florida rate also ended
May 2012 at 8.6 percent, while the national 13.7% was down from 16% in the second in size.
rate posted 8.2 percent. quarter of 2011 and 15.2% in 2010.
Westshore – touted for its many newer Class A Other properties are expected to come to
Source: US Bureau of Labor Statistics
buildings and proximity to Tampa International market in the second half of 2012, particularly
Airport, downtown Tampa and Clearwater – in the Tampa CBD and Westshore, due to pent
has seen its overall vacancy rate fall more than up demand and stabilizing fundamentals of
4 percentage points since 2010. well-leased office projects.
TRANSACTION UPDATE
SALES ACTIVITY
PROPERTY NAME CLASS BUYER NAME SIZE SF SALES PRICE SUBMARKET
409 Bayshore Blvd B Tampa General Hospital 53,481 $16,777,347 ($313.71/sf) South Tampa
Waterview at Feather Sound A BMD Management 80,445 $9,525,000 ($118.40/sf) Gateway
Watermark - Buildings 5 & 7 B/C Empire Solutions 53,867 $3,750,000 ($69.62/sf) Westshore
100 W. Kennedy Blvd B Convergent Management LLC 67,615 $2,200,000 ($32.54/sf) Tampa CBD
LEASING ACTIVITY
PROPERTY NAME CLASS TENANT NAME SIZE (SF) LEASE TYPE SUBMARKET
Premier Corporate Center B WellCare Health Plans Inc. 66,000 New Carrollwood
Roosevelt Technology Center* A eMASON, Inc. 40,647 New Gateway
Bay Vista Gardens II* C Equant, Inc. 21,665 Renewal North Pinellas
Harbourside* A EmCare 19,819 New Bayside
Northdale Executive Center I* A PCL Civil Constructors, Inc. 19,195 Renewal Northwest Tampa
Promenade at Park Place* B Human Medical Plans, Inc. 7,953 New Bayside
Wells Fargo Center* A Linkshare Corporation 6,519 Renewal Tampa CBD
*Colliers International Transaction
P. 2 | COLLIERS INTERNATIONAL TAMPA BAY FLORIDA
3. RESEARCH REPORT | Q2 2012 | OFFICE | COLLIERS INTERNATIONAL TAMPA BAY FLORIDA
UPDATE SUBMARKET COMPARISONS
SUBMARKET BREAKDOWN
Total Net Absorp. New
Property Total Inventory Direct Vac. Net Absorp. YTD Under Avg. Direct Asking Rate Full
Bldgs. Vac. Current Completions
Class S.F. % S.F. Construc. S.F. Service
% Qtr. S.F. S.F.
TAMPA CBD
A 12 4,800,639 14.4% 15.4% 867 -7,901 0 0 $23.13/fs
B,C 62 3,643,678 11.4% 11.5% 21,838 31,939 0 0 $18.01/fs
Overall 74 8,444,317 13.1% 13.7% 22,705 24,038 0 0 $21.37/fs
WESTSHORE
A 40 7,614,612 17.5% 17.9% 115,457 86,337 0 250,000 $25.86/fs
B,C 203 7,938,573 11.7% 12.7% -25,979 -25,256 0 36,000 $19.03/fs
Overall 243 15,553,185 14.6% 15.2% 89,478 61,081 0 286,000 $23.06/fs
I-75 CORRIDOR
A 43 6,736,779 14.7% 15.6% 73,920 38,936 0 0 $21.37/fs
B,C 281 9,191,110 18.0% 18.2% 886 83,483 0 0 $17.28/fs
Overall 324 15,927,889 16.6% 17.1% 74,806 122,419 0 0 $18.87/fs
NORTH PINELLAS
A 15 1,320,092 15.7% 15.7% 49,811 34,568 0 0 $19.08/fs
B,C 154 3,767,782 17.7% 17.7% -39,600 -22,670 0 0 $16.00/fs
Overall 169 5,087,874 17.2% 17.2% 10,211 11,898 0 0 $17.02/fs
GATEWAY
A 24 3,077,170 4.0% 5.7% -10,608 -43,411 0 0 $20.89/fs
B,C 123 4,760,050 16.9% 17.2% 11,747 -30,354 0 0 $16.39/fs
Overall 147 7,837,220 11.8% 12.7% 1,139 -73,765 0 0 $17.52/fs
ST. PETERSBURG CBD
A 9 1,609,161 18.5% 19.3% 56,494 56,206 0 0 $22.29/fs
B,C 54 2,157,478 9.2% 9.2% 4,576 2,644 0 0 $17.82/fs
Overall 63 3,766,639 13.2% 13.5% 61,070 58,850 0 0 $20.22/fs
TAMPA BAY OVERALL OFFICE MARKET
Total Net Absorp. Net New Overall Avg. Class A Avg.
Total Inventory Direct Vac. Under
Qtr. & Year Bldgs. Vac. Current Absorp. Completions Direct Asking Direct Asking
S.F. % Construc. S.F.
% Qtr. S.F. YTD S.F. S.F. Rate F.S. Rate F.S.
2012 2Q 1,768 79,257,603 15.4% 15.9% 203,854 -39,677 15,302 374,000 $19.16/fs $23.04/fs
2012 1Q 1,767 79,242,301 15.7% 16.1% -243,531 -243,531 53,500 389,302 $19.36/fs $23.20/fs
2011 4Q 1,765 79,188,801 15.4% 15.8% 428,794 451,564 0 442,802 $19.59/fs $23.29/fs
2011 3Q 1,765 79,188,801 16.0% 16.3% 207,617 22,770 0 120,802 $19.63/fs $23.35/fs
2011 2Q 1,765 79,188,801 16.2% 16.6% -100,762 -184,847 0 105,500 $19.59/fs $23.16/fs
2011 1Q 1,765 79,188,801 16.0% 16.4% -84,085 -84,085 10,492 105,500 $19.72/fs $23.18/fs
2010 4Q 1,764 79,178,309 15.9% 16.3% 177,975 74,300 0 98,492 $19.93/fs $23.44/fs
2010 3Q 1,764 79,178,309 16.0% 16.6% 261,427 -103,675 0 98,492 $19.97/fs $23.61/fs
2010 2Q 1,764 79,178,309 16.3% 16.9% -214,003 -365,102 29,034 98,492 $20.01/fs $23.58/fs
COLLIERS INTERNATIONAL TAMPA BAY FLORIDA | P. 3
4. RESEARCH REPORT | Q2 2012 | OFFICE | COLLIERS INTERNATIONAL TAMPA BAY FLORIDA
SUBMARKET MAP
522 offices in
62 countries on
6 continents
United States: 147
Canada: 37
Latin America: 19
Asia Pacific: 201
EMEA: 118
• $1.8 billion in annual revenue
• 1.25 billion square feet under
management
• Over 12,300 professionals
TAMPA BAY CITY LEADER:
Ryan Kratz
Executive Vice President
Brokerage | Marketing | Operations
Corporate Office
311 Park Place Boulevard
Suite 600
Clearwater, FL 33759
John Gerlach, CCIM TEL +1 727 442 7184
Alan Feldshue Jeff Tolrud, CCIM
Managing Director Office Services Managing Director, Office Services Managing Director Investment
alan.feldshue@colliers.com jeff.tolrud@colliers.com Services
www.colliers.com/Alan.Feldshue www.colliers.com/Jeff.Tolrud john.gerlach@colliers.com
www.colliers.com/John.Gerlach
Carol Warren, CCIM Jim Allen Mia Jarrell
Senior Director Managing Director Managing Director, Office Services
Commercial Services Healthcare Services Group mia.jarrell@colliers.com
carol.warren@colliers.com jim.allen@colliers.com www.colliers.com/Mia.Jarrell
www.colliers.com/Carol.Warren www.colliers.com/Jim.Allen
Christopher Leonard, CCIM Ryan Kratz Mary Clare Codd, CCIM, SIOR RESEARCH CONTACT:
Director, Commercial Sales Executive Vice President Senior Office & Industrial Specialist
christopher.leonard@colliers.com Brokerage | Marketing | Operations maryclare.codd@colliers.com Matt Dolan
www.colliers.com/ ryan.kratz@colliers.com www.colliers.com/MaryClare.Codd
Christopher.Leonard www.colliers.com/Ryan.Kratz GIS & Research Administrator
Claire Calzon Jim Parker, CCIM Melanie Jackson Market: Tampa Bay
Managing Director Director Commercial Services Senior Associate Office Services TEL +1 813 221 2290
Office Services jim.parker@colliers.com melanie.jackson@colliers.com
claire.calzon@colliers.com www.colliers.com/Jim.Parker www.colliers.com/Melanie.Jackson FAX +1 813 224 9403
www.colliers.com/Claire.Calzon
EMAIL matt.dolan@colliers.com
Mackenzie Gerlach Joanne LeBlanc Kevin Yeager
Associate, Investment Services Associate, Office Services Senior Associate, Office Services
mackenzie.gerlach@colliers.com joanne.leblanc@colliers.com kevin.yeager@colliers.com
www.colliers.com/ www.colliers.com/ www.colliers.com/Kevin.Yeager
Mackenzie.Gerlach Joanne.LeBlanc
Copyright @ 2012 Colliers International
The information contained herein has been obtained from sources deemed reliable. While every reasonable effort has been made to ensure its accuracy,
we cannot guarantee it. No responsibility is assumed for any inaccuracies. Readers are encouraged to consult their professional advisors prior to acting
Tampa Bay Florida
on any of the material contained in this report.
This report includes owner and non-owner occupied space 10,000 sf and greater. Directional arrows compare current quarter to previous quarter Accelerating success.
numbers. Arrows show change when there is a 10 cent or more change in lease rate or 0.5% or more change in vacancy rate. Due to continual updates
and refinements in the historical database, some of the data in this report may not match data published in previous reports. Sources: Costar Property
and Colliers International Tampa Bay Florida.
www.colliers.com/marketname