7 - stem & leaf plots
Download as PPT, PDF0 likes505 views
Stem and leaf plots provide a concise way to represent and compare numerical data. They organize values into "stems" and "leaves" with the stems forming groups and the leaves providing the actual values within each group. The document provides examples of stem and leaf plots showing Babe Ruth's home runs by year and the ages of US presidents at their first inauguration.
1 of 6
Downloaded 10 times


Recommended
Fall 2020 JOU 3304 19th Class October 26, 2020
Fall 2020 JOU 3304 19th Class October 26, 2020Michael Rizzo
?
This document contains notes from a sports writing class. It discusses statistical metrics in sports writing, predictive analytics, choosing relevant statistics to report, and how statistics can help sportswriters challenge assumptions, find new stories, and analyze strategy. Students are assigned a 250-300 word story on sports fans and the World Series for Thursday, including an interview with a fan commenting on the Series.30 shades of content | 30 tips for content marketing
30 shades of content | 30 tips for content marketingmascha_dudu
?
The document provides 30 tips for generating engaging social media content. Some of the tips include attracting people with mystery, sharing quotes from others, asking clients for references, showing humor, explaining industry terms simply, showing work processes, sharing mistakes and lessons learned, and creating infographics. The overall message is that sharing a variety of content types, from the professional to the personal, can help engage audiences on social media.đēPĪ?ŨÓģÖĪÁĪηōļūĪŽĨģĨïĐ`ĨĨóĨ°ĨđĨÚĐ`ĨđÔËÓĪōĪ·ĪÆĪëĨïĨą
đēPĪ?ŨÓģÖĪÁĪηōļūĪŽĨģĨïĐ`ĨĨóĨ°ĨđĨÚĐ`ĨđÔËÓĪōĪ·ĪÆĪëĨïĨąKojiro Fukazawa
?
PechaKuchaNight Osaka vol.3ĪËĪÆ°kąíĄĢ

Key Measurements For Testers
Key Measurements For TestersGopi Raghavendra
?
This document discusses key measurements for testers, including precision vs accuracy. It provides examples to illustrate the difference between precision and accuracy. The document also discusses goals for testing, including using the SMART framework. It introduces the GQM methodology for defining test goals and questions. Additional sections cover test planning and resources, defect tracking, defect prediction, and release criteria.
Marketing v sociĻĒlnĻŠch mĻĶdĻŠch | 2. hodina | Kolik sĻŠtĻŠ znĻĒ? | Typologie sociĻĒ...
Marketing v sociĻĒlnĻŠch mĻĶdĻŠch | 2. hodina | Kolik sĻŠtĻŠ znĻĒ? | Typologie sociĻĒ...mascha_dudu
?
Abychom si v?ichni srovnali zĻĒkladnĻŠ znalosti, definovali jsme si pojem "sociĻĒlnĻŠ mĻĶdium" jako zast?e?ujĻŠcĻŠ pro dal?ĻŠ r?znĻĶ slu?by nebo aplikace. SociĻĒlnĻŠ mĻĶdia tedy dĻ§lĻŠme nap?ĻŠklad na blogy, mikroblogy, diskusnĻŠ fĻŪra, sociĻĒlnĻŠ sĻŠtĻ§, LBS, nĻĒstroje pro sdĻŠlenĻŠ multimĻĶdiĻŠ a dal?ĻŠ. Tak?e ?e? byla p?edev?ĻŠm o Facebooku, Twitteru, Instagramu, Pinterestu, Tumbleru, Google+, LinkedInu, šÝšÝßĢshare aj. slu?bĻĒch a o tom, jak je mo?nĻĶ je marketingovĻ§ vyu?ĻŠt.Mobile App - Jmeter (1)
Mobile App - Jmeter (1)Gopi Raghavendra
?
This document provides instructions for configuring a mobile device to use a JMeter HTTP proxy server for load testing mobile web applications. It describes starting the JMeter HTTP proxy server on a computer, getting the computer's IP address, and then configuring the mobile device's network settings to use that computer as a proxy. Finally, it notes that the mobile web application can then be accessed normally through the proxy to simulate user actions for load testing purposes.Tudor deck 10-30-15
Tudor deck 10-30-15Tudor Ice Company
?
This document outlines a business plan for a new company called Tudor Ice that aims to introduce a new type of packaged ice designed to overcome issues with traditional ice. Tudor Ice would produce ice at its plant, transport it ambiently in disposable containers, and target the on-premise food and beverage market. The founders have relevant experience and the company has received seed funding and aims to raise a Series A round. Projections show rapid revenue growth over the next five years as the company expands to new markets.Esposito gerard psp0113_week2
Esposito gerard psp0113_week2GerardEsposito
?
Daphne Bavelier studies how the brain adapts to changes in experience through nature or training. She examines how experience shapes the brain's structure and function over time. Her research focuses on understanding plasticity in the adult brain.
QRbodies Open Tattoo
QRbodies Open Tattoomascha_dudu
?
QR kĻŪd vytetovan? na tĻ§le umo?Ļūuje komukoliv se do tetovĻĒnĻŠ nalogovat p?es interface na www.opentattoo.cz a mĻ§nit jeho obsah. Log in! Change the tattoo! Change the body!Apbd lombok utara 2013 citizen budget
Apbd lombok utara 2013 citizen budgetGatot Sulistoni
?
The document is a collection of dates from December 16, 2013 numbered 1 through 52. It does not contain any other text, so it provides no essential information beyond listing dates from that year.Boostrapping and Fundraising - Founder's Institute 
Boostrapping and Fundraising - Founder's Institute Tudor Ice Company
?
This document discusses various methods for bootstrapping and fundraising for a startup, including bootstrapping, friends and family funding, angel investors, venture capitalists, and banks. It provides advantages and disadvantages of bootstrapping, requirements for pitching to angels like projections and an MVP, differences between angels and VCs, and the importance of establishing milestones and an exit strategy. Contact information is provided for further resources.Apbd dompu 2013 citizen budget
Apbd dompu 2013 citizen budgetGatot Sulistoni
?
The document is a collection of dates from December 16, 2013 numbered 1 through 52. It does not contain any other text, so it provides no essential information beyond listing dates from that year.Don't Leave Windows Broken
Don't Leave Windows BrokenKen William
?
This document contains the agenda and slides for a presentation on avoiding broken windows in software development. The presentation covers linting with ESLint to catch errors, unit testing with Karma and Jasmine, and understanding bad parts of JavaScript like type coercion. It includes an introduction of the speaker, the goal of avoiding technical debt, and examples of linting and writing unit tests.Kkd2063 khairiah abdulkadird20121061507kepentingan sahsiah
Kkd2063 khairiah abdulkadird20121061507kepentingan sahsiahKhairiah Abdul Kadir
?
Teks tersebut membahas tentang 3 poin utama:
1. Definisi pembangunan sahsiah dan kepentingannya, termasuk ciri-ciri sahsiah unggul.
2. Proses pertumbuhan diri dan bagaimana perubahan sahsiah merupakan proses pertumbuhan.
3. Faktor-faktor yang mempengaruhi personaliti seseorang.6 - mapping diagrams; functions as words & equations; input-output tables, r...
6 - mapping diagrams; functions as words & equations; input-output tables, r...Anthony_Maiorano
?
This document provides instruction and practice problems for sixth grade students on mapping diagrams and functions. It begins with an essential question about what a mapping diagram is and how it can represent a function. It then provides examples of mapping diagrams and practice problems for students to draw mapping diagrams, list ordered pairs, and describe patterns algebraically. The document concludes with assigning homework for students to complete.
Beckman.dedication projecet
Beckman.dedication projecetJessie Seeley
?
This document is a collection of poems and explanations written by Jessica Beckman for a poetry dedication project given to her mother. It includes an introductory letter thanking her mother for her love and support over the years. Several poems are included about themes of family, children, and loss. Explanations provide context for each poem and their relevance to the author's life and relationship with her mother. The overall tone is one of gratitude, love, and remembrance.Testing Services
Testing ServicesGopi Raghavendra
?
This document summarizes the testing services offered by QA Programmer, including functional testing, non-functional testing, mobile testing, performance testing, security testing and more. It provides details on the experienced testing team, the various tools used for testing, and the types of applications and domains they can test in.
15 keywords & figures to understand tablet users
15 keywords & figures to understand tablet usersSMARTPULSE
?
Tablet adoption has been one of the most striking phenomenon of the past 30 months. But do we really know how they are used by consumers? SmartPulse gathered 15 keywords and figures to better understand tablet usage.

Divisibility rules
Divisibility rulesAnthony_Maiorano
?
This document discusses divisibility rules, which are ways to determine if one number can be divided evenly by another number without a remainder. It provides the rules for divisibility by 2, 3, 4, 5, 6, 8, 9, 10 and notes there is no simple rule for 7. The rules are based on patterns in the digits of the number being divided. For example, a number is divisible by 2 if the last digit is even, and divisible by 3 if the sum of the digits is 3, 6, or 9. The document also provides examples and asks the reader to apply the rules to several numbers.Paritial quotients ppt
Paritial quotients pptAnthony_Maiorano
?
This document discusses the partial quotients method for long division of whole numbers. It provides an example of dividing 177 by 8 using partial quotients. The divisor (8) is broken into "partial quotients" of 10, 10, and 2, which are multiplied and subtracted until the remainder is reached. The summary explains that different partial quotients could have been chosen, and picking ones closer to the final answer would solve it in fewer steps. It also shows an alternate way to solve the same problem using an initial partial quotient of 20.World war one
World war oneAnthony_Maiorano
?
The document summarizes the key causes of World War 1, including militarism, alliances, imperialism, nationalism, and the assassination of Archduke Franz Ferdinand. It also discusses how new weapons like machine guns, poison gas, submarines, airplanes, and tanks led to stalemate trench warfare on the Western Front. The results of WWI included Germany's surrender, the Treaty of Versailles holding Germany responsible, reparations, and the formation of the League of Nations to prevent future wars. Total casualties from all countries exceeded 8.5 million deaths.7 - the stans ppt
7 - the stans pptAnthony_Maiorano
?
The document discusses the five Central Asian countries known as the "Stans": Kazakhstan, Uzbekistan, Turkmenistan, Tajikistan, and Kyrgyzstan. It summarizes that the countries have a total population of around 60 million people who are ethnically diverse and mostly Muslim. While the economies were still communist to some degree, they rely on agriculture like livestock, grains, and cotton in the various climates that range from cooler mountains to arid deserts where access to water is important.More Related Content
Viewers also liked (18)
Mobile App - Jmeter (1)
Mobile App - Jmeter (1)Gopi Raghavendra
?
This document provides instructions for configuring a mobile device to use a JMeter HTTP proxy server for load testing mobile web applications. It describes starting the JMeter HTTP proxy server on a computer, getting the computer's IP address, and then configuring the mobile device's network settings to use that computer as a proxy. Finally, it notes that the mobile web application can then be accessed normally through the proxy to simulate user actions for load testing purposes.Tudor deck 10-30-15
Tudor deck 10-30-15Tudor Ice Company
?
This document outlines a business plan for a new company called Tudor Ice that aims to introduce a new type of packaged ice designed to overcome issues with traditional ice. Tudor Ice would produce ice at its plant, transport it ambiently in disposable containers, and target the on-premise food and beverage market. The founders have relevant experience and the company has received seed funding and aims to raise a Series A round. Projections show rapid revenue growth over the next five years as the company expands to new markets.Esposito gerard psp0113_week2
Esposito gerard psp0113_week2GerardEsposito
?
Daphne Bavelier studies how the brain adapts to changes in experience through nature or training. She examines how experience shapes the brain's structure and function over time. Her research focuses on understanding plasticity in the adult brain.QRbodies Open Tattoo
QRbodies Open Tattoomascha_dudu
?
QR kĻŪd vytetovan? na tĻ§le umo?Ļūuje komukoliv se do tetovĻĒnĻŠ nalogovat p?es interface na www.opentattoo.cz a mĻ§nit jeho obsah. Log in! Change the tattoo! Change the body!Apbd lombok utara 2013 citizen budget
Apbd lombok utara 2013 citizen budgetGatot Sulistoni
?
The document is a collection of dates from December 16, 2013 numbered 1 through 52. It does not contain any other text, so it provides no essential information beyond listing dates from that year.Boostrapping and Fundraising - Founder's Institute
Boostrapping and Fundraising - Founder's Institute Tudor Ice Company
?
This document discusses various methods for bootstrapping and fundraising for a startup, including bootstrapping, friends and family funding, angel investors, venture capitalists, and banks. It provides advantages and disadvantages of bootstrapping, requirements for pitching to angels like projections and an MVP, differences between angels and VCs, and the importance of establishing milestones and an exit strategy. Contact information is provided for further resources.Apbd dompu 2013 citizen budget
Apbd dompu 2013 citizen budgetGatot Sulistoni
?
The document is a collection of dates from December 16, 2013 numbered 1 through 52. It does not contain any other text, so it provides no essential information beyond listing dates from that year.Don't Leave Windows Broken
Don't Leave Windows BrokenKen William
?
This document contains the agenda and slides for a presentation on avoiding broken windows in software development. The presentation covers linting with ESLint to catch errors, unit testing with Karma and Jasmine, and understanding bad parts of JavaScript like type coercion. It includes an introduction of the speaker, the goal of avoiding technical debt, and examples of linting and writing unit tests.Kkd2063 khairiah abdulkadird20121061507kepentingan sahsiah
Kkd2063 khairiah abdulkadird20121061507kepentingan sahsiahKhairiah Abdul Kadir
?
Teks tersebut membahas tentang 3 poin utama:
1. Definisi pembangunan sahsiah dan kepentingannya, termasuk ciri-ciri sahsiah unggul.
2. Proses pertumbuhan diri dan bagaimana perubahan sahsiah merupakan proses pertumbuhan.
3. Faktor-faktor yang mempengaruhi personaliti seseorang.6 - mapping diagrams; functions as words & equations; input-output tables, r...
6 - mapping diagrams; functions as words & equations; input-output tables, r...Anthony_Maiorano
?
This document provides instruction and practice problems for sixth grade students on mapping diagrams and functions. It begins with an essential question about what a mapping diagram is and how it can represent a function. It then provides examples of mapping diagrams and practice problems for students to draw mapping diagrams, list ordered pairs, and describe patterns algebraically. The document concludes with assigning homework for students to complete.Beckman.dedication projecet
Beckman.dedication projecetJessie Seeley
?
This document is a collection of poems and explanations written by Jessica Beckman for a poetry dedication project given to her mother. It includes an introductory letter thanking her mother for her love and support over the years. Several poems are included about themes of family, children, and loss. Explanations provide context for each poem and their relevance to the author's life and relationship with her mother. The overall tone is one of gratitude, love, and remembrance.Testing Services
Testing ServicesGopi Raghavendra
?
This document summarizes the testing services offered by QA Programmer, including functional testing, non-functional testing, mobile testing, performance testing, security testing and more. It provides details on the experienced testing team, the various tools used for testing, and the types of applications and domains they can test in.15 keywords & figures to understand tablet users
15 keywords & figures to understand tablet usersSMARTPULSE
?
Tablet adoption has been one of the most striking phenomenon of the past 30 months. But do we really know how they are used by consumers? SmartPulse gathered 15 keywords and figures to better understand tablet usage.More from Anthony_Maiorano (20)
Divisibility rules
Divisibility rulesAnthony_Maiorano
?
This document discusses divisibility rules, which are ways to determine if one number can be divided evenly by another number without a remainder. It provides the rules for divisibility by 2, 3, 4, 5, 6, 8, 9, 10 and notes there is no simple rule for 7. The rules are based on patterns in the digits of the number being divided. For example, a number is divisible by 2 if the last digit is even, and divisible by 3 if the sum of the digits is 3, 6, or 9. The document also provides examples and asks the reader to apply the rules to several numbers.Paritial quotients ppt
Paritial quotients pptAnthony_Maiorano
?
This document discusses the partial quotients method for long division of whole numbers. It provides an example of dividing 177 by 8 using partial quotients. The divisor (8) is broken into "partial quotients" of 10, 10, and 2, which are multiplied and subtracted until the remainder is reached. The summary explains that different partial quotients could have been chosen, and picking ones closer to the final answer would solve it in fewer steps. It also shows an alternate way to solve the same problem using an initial partial quotient of 20.World war one
World war oneAnthony_Maiorano
?
The document summarizes the key causes of World War 1, including militarism, alliances, imperialism, nationalism, and the assassination of Archduke Franz Ferdinand. It also discusses how new weapons like machine guns, poison gas, submarines, airplanes, and tanks led to stalemate trench warfare on the Western Front. The results of WWI included Germany's surrender, the Treaty of Versailles holding Germany responsible, reparations, and the formation of the League of Nations to prevent future wars. Total casualties from all countries exceeded 8.5 million deaths.7 - the stans ppt
7 - the stans pptAnthony_Maiorano
?
The document discusses the five Central Asian countries known as the "Stans": Kazakhstan, Uzbekistan, Turkmenistan, Tajikistan, and Kyrgyzstan. It summarizes that the countries have a total population of around 60 million people who are ethnically diverse and mostly Muslim. While the economies were still communist to some degree, they rely on agriculture like livestock, grains, and cotton in the various climates that range from cooler mountains to arid deserts where access to water is important.8 - graphs discrete & continuous domains
8 - graphs discrete & continuous domainsAnthony_Maiorano
?
- The document discusses discrete and continuous domains in functions. A discrete domain is made up of distinct, unconnected points, while a continuous domain includes all numbers on the number line and makes connected lines or curves.
- One example shows a discrete function with domain values of 0, 1, 2, 3, 4, representing ticket prices. Another shows a continuous function for cheese prices with domain values from 0 to any fraction or decimal.
- Key differences are that discrete domains only include certain numbers while continuous domains include all numbers in the given interval.8 ss - the age of imperialism 1850 -- 1914
8 ss - the age of imperialism 1850 -- 1914Anthony_Maiorano
?
1) European imperialism in the late 19th century was driven by industrialization and the need for new markets, resources, and land for military and trade posts.
2) Europeans scrambled to claim territories in Africa, dividing the continent at the 1884 Berlin Conference with little regard for local populations and cultures.
3) British imperialism expanded to control many regions including India, Nigeria, and Southeast Asia, often exploiting local peoples for economic gain and imposing colonial rule.
4) Western imperialism challenged Chinese sovereignty through the Opium Wars and unequal treaties, fueling Chinese nationalism, while Japan modernized and itself became an imperial power.6 - analyzing graphs
6 - analyzing graphsAnthony_Maiorano
?
The document discusses analyzing graphs and the relationship between dependent and independent variables. It defines a linear function as one where the output changes linearly in proportion to the input. Examples of linear and non-linear graphs are provided to illustrate the difference. Students are assigned homework analyzing graphs from a workbook.8 ss - american journey 19.4 industrial workers
8 ss - american journey 19.4 industrial workersAnthony_Maiorano
?
Workers during the Industrial Revolution faced difficult working conditions like long hours, low pay, and unsafe factories. This led workers to form labor unions like the Knights of Labor to demand better treatment and rights through collective bargaining and strikes. Unions helped workers gain political power and influence by organizing large numbers of members to push for changes in laws around issues like child labor, wages, and working hours.8 - railroad expansion ppt
8 - railroad expansion pptAnthony_Maiorano
?
During the late 1800s, new technologies led to rapid industrial growth and expansion of railroads in the United States. The construction of transcontinental railroads in the 1860s-1890s increased the miles of track nearly fivefold and united the eastern and western parts of the country physically and economically. The railroad expansion promoted trade, provided jobs, and made the settlement of the West easier by connecting new and existing towns across the nation. It also led to the establishment of standard time zones for the entire country.8 - using linear equations to solve word problems
8 - using linear equations to solve word problemsAnthony_Maiorano
?
The document discusses using linear equations to solve word problems, which usually deal with changes over time. It provides examples of common core standards related to proportional relationships, linear equations, and functions. It also defines key vocabulary words and outlines the UNRAAVEL strategy for solving word problems step-by-step. Finally, it works through examples of word problems and their solutions using linear equations.7 SS -- Ancient Chinese Civilizations (Chapter 4.1)
7 SS -- Ancient Chinese Civilizations (Chapter 4.1)Anthony_Maiorano
?
Ancient Chinese civilization extended back nearly 4,000 years and was ruled by a succession of dynasties. Key dynasties included the Xia, Shang, Zhou, Qin, and Han dynasties. The Han Dynasty ruled for 400 years and made important contributions such as developing the Silk Road, expanding trade, and establishing a strong central government. Chinese philosophy and religion also developed, with Confucianism, Daoism, and Buddhism influencing Chinese thought and culture.Three dimensional geometry
Three dimensional geometryAnthony_Maiorano
?
Three-Dimensional Geometry discusses spatial relations and three-dimensional figures. It explains that three-dimensional figures have faces, edges, and vertices. The document provides examples and formulas for calculating the volumes of prisms, cylinders, cones, pyramids and cubes. It also discusses surface area and provides examples and formulas for calculating surface areas of prisms and cylinders.Math rap
Math rapAnthony_Maiorano
?
This document shows how to solve a simple mathematical equation, x+3=5, by subtracting 3 from both sides, leaving x=2 as the solution. It demonstrates subtracting 3 from both sides of the equation to isolate the variable x on one side.7 - similar figures
7 - similar figuresAnthony_Maiorano
?
Similar figures are two figures that are the same shape but can differ in size. To be similar, the corresponding sides must be proportional, meaning they differ by a constant scale factor. The angles of similar figures will always be congruent since similarity preserves angles. Similarity can be used to solve real-world problems involving scale diagrams or finding unknown heights and distances.Scale drawing ppt
Scale drawing pptAnthony_Maiorano
?
This document provides a lesson on scale drawings. It begins with warm up problems, the problem of the day, and introduces the key concepts of scale drawings - including scale, reduction, enlargement, and using proportions to determine unknown scales and lengths. Examples are provided to demonstrate determining actual lengths from scale drawings and vice versa. The lesson concludes with a vocabulary section and quiz questions.Solve sysbyelimmult (1)
Solve sysbyelimmult (1)Anthony_Maiorano
?
The document provides steps for solving systems of equations using the elimination method with multiplication. It begins by stating the objective of being able to solve systems using this method. It then provides examples of solving three systems of equations using the following steps: 1) put the equations in standard form, 2) determine which variable to eliminate, 3) multiply the equations to make the coefficients equal and solve, 4) plug back into one equation to find the other variable, and 5) check the solution. It concludes by reviewing questions about these steps.6 - problem solving 1997 ppt
6 - problem solving 1997 pptAnthony_Maiorano
?
The key words here are "each" and "trips" which indicates multiplication.8 - antebellum america
8 - antebellum americaAnthony_Maiorano
?
The document provides an overview of the economic, social, and political differences between the antebellum North and South. The North's economy was based on manufacturing and industry while the South relied on slave labor to grow cash crops like cotton. These diverging economic systems led to conflicts over the expansion of slavery and states' rights, ultimately resulting in the American Civil War.8 - solving systems of linear equations by adding or subtracting
8 - solving systems of linear equations by adding or subtractingAnthony_Maiorano
?
Here are the steps to solve this system of equations using elimination by multiplication:
1. Put the equations in standard form:
3x + y = 4
4x + 4y = 6
2. Determine which variable to eliminate. The y-terms have coefficients that are not the same, so multiply the top equation by 4 to make the y-coefficients the same:
12x + 4y = 16
4x + 4y = 6
3. Subtract the equations to eliminate y:
12x + 4y = 16
- (4x + 4y = 6)
8x = 10
x = 5/4
4. Plug x back into an original equation and7 ss latitude & longitude
7 ss latitude & longitudeAnthony_Maiorano
?
1. Lines of latitude and longitude combine to form a grid that maps locations globally.
2. Latitude lines run east-west and are horizontal, while longitude lines run north-south and are vertical.
3. The equator is 0 degrees latitude, while the prime meridian is 0 degrees longitude.Recently uploaded (20)
Let's Build a House Price Predictor with Google Cloud!.pdf
Let's Build a House Price Predictor with Google Cloud!.pdfinfogdgmi
?
Going through the code of a Machine Learning project to predict real estate prices based on user-provided features using a Streamlit interface, leveraging Google Cloud services for data storage, model training, and deployment.
Blending AI in Enterprise Architecture.pdf
Blending AI in Enterprise Architecture.pdfCalvin Hendryx-Parker
?
C-level executives, directors, and product managers face the complex task of integrating AI into existing systems while addressing challenges related to data quality, scalability, interoperability, ethics, skill gaps, and security compliance.
Join Calvin Hendryx-Parker ĄŠ AWS Hero and CTO of Six Feet Up, the premier AI and Python agency in the U.S. ĄŠ for this interactive talk exploring generative AI technologies. YouĄŊll gain ready-to-use resources and a clear understanding of how to roll out AI in your organization.
What YouĄŊll Learn:
AI Implementation Strategies: Get practical tips on evaluating and integrating open source and closed AI models, addressing governance, compliance, and scalability.
Real-Case Demo: Explore what it takes to leverage generative AI technology using RAG.
Team Enablement: Discover how other companies are fostering innovation internally.
Walk away with the tools and insights you need to confidently lead your organizationĄŊs AI journey.AEM Branding Rollout: How to Minimize Downtime & Improve Efficiency
AEM Branding Rollout: How to Minimize Downtime & Improve EfficiencyNikhil Gupta
?
? AEM Branding Rollout: Traditional vs. Modern Approach ĻC Which One Wins?
Branding rollouts in Adobe Experience Manager (AEM) can be complex, especially when multiple websites share the same codebase. Organizations often struggle with minimizing downtime, ensuring scalability, and maintaining content consistency.
This case study explores two approaches to implementing branding changes in AEM:
? Traditional Approach ĻC Requires a maintenance page, causing downtime & disruption
? Modern Approach ĻC Uses language-level property activation for zero-downtime rollouts
? What YouĄŊll Learn:
? How to roll out branding updates without downtime
? A side-by-side comparison of Traditional vs. Modern Approaches
? The scalability & efficiency benefits of the Modern Approach
? Lessons learned and best practices for enterprise deployments
? Thinking about implementing a similar strategy?
Download the full case study here ? bit.ly/AEM-Rollout-CaseStudy
? LetĄŊs Connect!
If youĄŊre working on digital transformation, front-end architecture, or large-scale branding rollouts, letĄŊs exchange insights! Connect with me on LinkedIn: Nikhil Gupta (PSM-I? & Lean Six Sigma Black Belt?)
? https://www.linkedin.com/in/mrnikhilgupta/
#AEM #AdobeExperienceManager #Branding #DigitalTransformation #Scalability #ZeroDowntime #FrontEndDevelopmentYEM Pay: A European man in a bank paying with YEM
YEM Pay: A European man in a bank paying with YEMSteve Hodgkiss
?
In an age where digital currencies are rapidly redefining our understanding of money, YEM Pay and the YEM Benchmark Coin stand out as formidable players in this space. Through the unique lens of a European man walking into a traditional bank, this article explores the intersections of old-world banking systems and the new-frontier of digital currencies. Rather than being a technical exposition, this narrative aims to provide clear insights into the practical applications of YEM Pay, its fundamental principles, and what it signifies for the future of finance. Join us on this journey to understand how digital currency can blend, challenge, and revolutionize existing financial systems.Solutions for Radiation Threats: The Zytekno Catalog
Solutions for Radiation Threats: The Zytekno Catalogomnicnc
?
Alright, here's a condensed version of the Zytekno radiation detection catalog description, aiming for under 1000 words:
Zytekno: Advanced Radiation Detection Solutions
Introduction:
Zytekno provides cutting-edge radiation detection technologies for diverse applications, ensuring safety and security. Our catalog features innovative solutions, from drones to wearable devices, designed for optimal performance in challenging environments.
Our Commitment:
We focus on innovation and reliability, integrating the latest advancements and rigorously testing our products.
Product Categories:
Drone-Based: Aerial surveillance for hard-to-reach areas.
Robotic: Autonomous operation in hazardous environments.
Vehicle-Mounted: Mobile monitoring for rapid deployment.
Portal: Automated screening for personnel and cargo.
Backpack/Wearable: Personal monitoring for first responders.
Array Camera: High-resolution radiation source imaging.
Exoskeleton: Wearable tech with enhanced mobility and detection.
Product Highlights:
Drone Systems: Equipped with high-sensitivity detectors and GPS navigation for comprehensive area coverage.
Robotic Platforms: Designed for hazardous environments, featuring remote control and customizable arms, and robotic dog platforms for complex terrain.
Vehicle Systems: Mobile monitoring with real-time data and GPS tracking for rapid response.
Portal Systems: Automated screening with customizable configurations and integrated access control.
Wearable Devices: Lightweight and ruggedized for personal monitoring with real-time alerts.
Array Cameras: High-resolution imaging for detailed radiation source analysis.
Exoskeletons: Enhanced mobility and radiation detection for personnel in hazardous areas.
Applications:
Nuclear monitoring and decommissioning.
Hazardous material handling and cleanup.
Border security and contraband detection.
Emergency response and search and rescue.
Environmental surveys and mapping.
Industrial inspections and security.
Military and defense applications.
Key Features:
High-sensitivity radiation detectors.
Real-time data transmission and analysis.
GPS-guided navigation and tracking.
Customizable payloads and sensor configurations.
Ruggedized and weather-resistant designs.
Automated alert systems.
Integrated access control.
Conclusion:
Zytekno delivers advanced radiation detection solutions tailored to meet the demands of diverse applications. Our commitment to innovation ensures reliable and effective technologies."Conflicts within a Team: Not an Enemy, But an Opportunity for Growth", Orest...
"Conflicts within a Team: Not an Enemy, But an Opportunity for Growth", Orest...Fwdays
?
Conflicts within a team are not always a bad sign. On the contrary, they can become a powerful tool for development. In this talk, Orest will share my experience and practical tools for resolving conflicts constructively, which help not only maintain harmony in the team but also improve its overall performance. You will learn how to turn conflicts into opportunities to strengthen team bonds, enhance communication skills, and achieve better results.Comprehensive Guide to Ansible Application Roles.pdf
Comprehensive Guide to Ansible Application Roles.pdfRHCSA Guru
?
šÝšÝßĢs on how to use Ansible application roles for efficient automation, configuration management, and deployment-part of RHCE syllabusCSUN 2025 - Personalization of Accessible Charts and Graphs.pptx
CSUN 2025 - Personalization of Accessible Charts and Graphs.pptx?ystein Moseng
?
šÝšÝßĢs from our presentation on personalization as a concept in dataviz accessibility, at CSUN 2025.[NYC Scrum] 4 bad ideas about productivity... and what Agilists should do ins...![[NYC Scrum] 4 bad ideas about productivity... and what Agilists should do ins...](https://cdn.slidesharecdn.com/ss_thumbnails/nycscrum4badideasaboutproductivity-250320014757-d85c2fbe-thumbnail.jpg?width=560&fit=bounds)
[NYC Scrum] 4 bad ideas about productivity... and what Agilists should do ins...Jason Yip
?
High interest rates and soft markets means requests to improve productivity have become much more common. This should actually be an advantage for Agile, Lean practitioners as principles and practices were always designed to do more with less.
It requires adjusting how you think about and talk about things AND it requires dropping well-meaning, but bad ideas that have popped up in our community.Women in Automation: Career Development & Leadership in Automation
Women in Automation: Career Development & Leadership in AutomationUiPathCommunity
?
The month of March is a month when we focus on the women in our community: their expertise and their achievements. But also their potential for guidance and mentorship as we look to find role models and help our entire community reach its maximum potential, in a gender diverse and inclusive environment.
Join us on March 19 for a first hand story on starting an automation career and leadership orientation as a woman expert in the automation field.
Agenda:
Choosing a career in automation as a woman, despite having a strong background in core software development
How a strong background in core development can be leveraged to build a career in automation/digital transformation
Choosing a technical role in automation rather than non-technical positions as a woman
Leading teams as a woman in TurkeyĄŊs tech industry
How professionals from fields other than computer engineering (both STEM and non-STEM) can transition into automation careers
Mentoring professionals from different fields in their automation careers
We are honored to have with us one of best women in automation advocates and professionals in Turkey:
??? Kardelen Cihangir, Technical Team Lead @VBM Turkey.
? If you have any questions or feedback, please refer to the "Women in Automation 2025" dedicated Forum thread. You can find there extra details and updates.
"Constructive Interaction During Emotional Burnout: With Local and Internatio...
"Constructive Interaction During Emotional Burnout: With Local and Internatio...Fwdays
?
One of the biggest challenges in workplace communication is expressing dissatisfaction and providing feedback. Over 50% of misunderstandings arise in these situations, regardless of the project. Add emotional burnout and cultural differences, and the consequences can become serious.
In his speech, Alexey will tell share feedback tools that work effectively for IT professionals. He will explore why many cultures struggle with giving and receiving constructive criticism and how fundamental argumentation principles, combined with simple empathy-based techniques, can help prevent more than half of potential conflicts.WSO2Con 2025 - Architecting Cloud-Native Applications
WSO2Con 2025 - Architecting Cloud-Native ApplicationsWSO2
?
As enterprises modernise their technology stacks, designing platform-agnostic, scalable, and well-governed cloud-native architectures is essential for long-term success. This lab session will explore how to apply the platformless concept to build cloud-native applications that offer flexibility, portability, and resilience across diverse cloud environments.
Through guided discussions and real-world insights, we will examine key architectural patterns, including microservices, API gateways, and Kubernetes orchestration, while addressing critical aspects such as scalability, governance, and operational efficiency.
Join us to exchange ideas, refine best practices, and explore strategies for architecting cloud-native applications that are future-proof, scalable, and effectively governed.The nature of technolog and Computer networks.pptx
The nature of technolog and Computer networks.pptxvallidevi6
?
Usefu for Grade 5 Cambridge Computing studentsReal World RAG: 5 common issues encountered when building Real World Applicat...
Real World RAG: 5 common issues encountered when building Real World Applicat...walterheck3
?
A deck explaining 5 of the bigger issues encountered when building a real-world RAG application like lorelai.app.
This deck was used for a presentation by Walter Heck during a DEMAND event.UIUX Design Course in Coimbatore with Internship
UIUX Design Course in Coimbatore with InternshipNextskill Technologies
?
Our comprehensive UIUX Design Course in Coimbatore offers hands-on training in user interface and user experience design, culminating in a guaranteed internship opportunity. Students master industry-standard tools like Figma, Adobe XD, and Sketch while learning essential principles of visual design, interaction design, and user research.
The curriculum balances theoretical knowledge with practical application through real-world projects, preparing students to create intuitive, accessible, and visually appealing digital experiences. Upon completion, participants transition seamlessly into a structured internship program where they apply their skills to actual client projects under professional guidance, building an impressive portfolio and gaining valuable industry experience that positions them for successful careers in the growing field of UIUX design.STIG in Action: Continuous Compliance with MITRE & Anchore
STIG in Action: Continuous Compliance with MITRE & AnchoreAnchore
?
Join us for part two of our STIG webinar series in partnership with MITRE. WeĄŊll discuss the latest NIST 800-53 and FedRAMP guidance that requires STIG adherence and how this protocol creates new demands on security and operations teams. Our hosts will share insights into how these new demands can be met with security tools that automate STIG compliance. Attendees will learn actionable steps on how to get rid of their traditional spreadsheets and paper binders as Anchore and MITRE hosts explore next generation STIG tooling and guidance.
Hosts Aaron Lippold, Chief Architect at MITRE, and Josh Bressers, VP of Security at Anchore, will demo how to:
- Leverage MITRE Security Automation Framework? to automate STIG scanning
- View and interpret the results of a STIG scan with MITRE SAF?
- Remediate STIG findings in container images
Automate reporting and replace traditional paper filesWSO2Con 2025 - Building AI Applications in the Enterprise (Part 1)
WSO2Con 2025 - Building AI Applications in the Enterprise (Part 1)WSO2
?
Building AI applications for the enterprise requires understanding key architectural patterns that enable powerful, scalable, and intelligent solutions. This session explores the core approaches to building AI-driven applications, including Generative AI, Retrieval-Augmented Generation (RAG), and AI Agents.
WeĄŊll dive into how to build and integrate AI apps, discover and connect them with enterprise tools, and manage authentication and authorization securely. Additionally, weĄŊll cover best practices for deploying AI-powered applications and how an AI Gateway can help monitor, secure, and optimize interactions between AI models, agents, and enterprise systems.Salesforce Welly March 2025User Group Meeting
Salesforce Welly March 2025User Group MeetingAnna Loughnan Colquhoun
?
This is the expanded slide deck from the Salesforce Wellington user group lunchtime meeting hosted by Forsyth Barr March 19, 2025.
Presentations were from Forsyth Barr, showing the Tempo app, as well as Katie Connors, Daneen Johnson and Anna Loughnan. Carl Thomas presented prizes for the Uppern Echeleon sponsored photo booth from our Xmas gatheringWSO2Con 2025 - Building Secure Business Customer and Partner Experience (B2B)...
WSO2Con 2025 - Building Secure Business Customer and Partner Experience (B2B)...WSO2
?
Building modern B2B applications requires addressing complex identity and access management needs, from seamless onboarding to managing organizational hierarchies and user relationships. This session dives into the challenges of developing B2B apps and showcases how WSO2 B2B CIAM solutions can simplify and enhance these aspects.
WeĄŊll explore key concepts such as organizational modeling, hierarchical structures, and organization onboarding strategies. YouĄŊll learn how to design secure user login experiences, implement "Bring Your Own Identity Provider" (BYO IdP) functionality, and connect users seamlessly to their organizations.
The session will also provide a preview of WSO2 IAM roadmap for B2B applications, highlighting upcoming features designed to address evolving business challenges.Landing Page A/B Testing with Melanie Bowles
Landing Page A/B Testing with Melanie BowlesJason Packer
?
March 2025 Columbus Data & Analytics Wednesday ĻC A/B Testing in a post Google Optimize World with with Melanie Bowles7 - stem & leaf plots
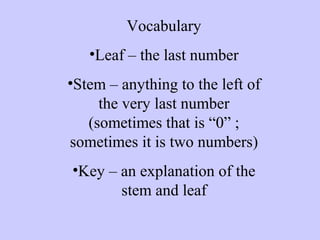
- 2. Vocabulary ?Leaf ĻC the last number ?Stem ĻC anything to the left of the very last number (sometimes that is Ą°0Ąą ; sometimes it is two numbers) ?Key ĻC an explanation of the stem and leaf
- 3. High temperatures for the last week: 72, 78, 87, 90, 88, 86, 87, 89 Stem 7 8 9 Leaf 2 8 6 7 7 8 9 0 7 2 = 72 degrees
- 4. Stem and Leaf Plot ? Here are the numbers of homeruns that Babe Ruth hit in each of his 15 years with the New York Yankees from 1920-1934: ĻC 54, 59, 35, 41, 46, 25, 47, 60, 54, 46, 49, 46, 41, 34, 22
- 5. 2 3 6 7 8 9 9 0 0 1 1 1 1 2 2 4 4 4 4 5 5 5 6 6 6 7 7 7 7 8 0 1 1 1 2 4 4 5 8 9 Stem Leaf 4 5 6 Age of United states Presidents at their First Inauguration: 57 61 57 57 58 57 61 54 68 51 49 64 50 48 65 52 56 46 54 49 50 47 55 54 42 51 56 55 51 54 51 60 62 43 55 56 61 52 69 64 (Through the 40th presidency) Key: 5 7 means 57Key: 5 7 means 57
- 6. 2 3 6 7 8 9 9 0 0 1 1 1 1 2 2 4 4 4 4 5 5 5 6 6 6 7 7 7 7 8 0 1 1 1 2 4 4 5 8 9 Stem Leaf 4 5 6 Age of United states Presidents at their First Inauguration: 57 61 57 57 58 57 61 54 68 51 49 64 50 48 65 52 56 46 54 49 50 47 55 54 42 51 56 55 51 54 51 60 62 43 55 56 61 52 69 64 (Through the 40th presidency) Key: 5 7 means 57Key: 5 7 means 57