AMCA Excel Regression (guide)
1 like932 views
This document provides instructions for performing regression analysis in Excel. It outlines the steps to: 1) ensure the Data Analysis add-in is installed, 2) select Regression from the Data Analysis tools, 3) select the data range and specify the options, 4) view the summary output table, 5) generate a chart with the regression line, 6) forecast new values using the regression equation, and 7) calculate the mean absolute deviation (MAD) from the residuals table.
1 of 13
Downloaded 70 times


Recommended
Finding areas for z using excel
Finding areas for z using excelSandra Nicks
╠²
This document provides instructions for using the NORMDIST and NORMINV functions in Excel to find areas under the normal curve and find x-values given areas. For NORMDIST, the user enters values for x, mean, standard deviation and selects true for cumulative to find the area from the left of the distribution to x. For NORMINV, the user enters the probability, mean and standard deviation to find the x-value corresponding to that area. Both note that results are for the cumulative area and adjustments may be needed for the area between the mean and x.Excel2002
Excel2002pprinik
╠²
This document provides instructions on using Excel functions and charts. It describes Excel components and arithmetic operators. It explains the order of precedence for calculations and how to use the Insert Function button to select functions. Examples show how to define functions within functions, examine the Insert Function dialog box, and create column and pie charts using the Chart Wizard. The Chart Wizard dialog boxes guide the user in selecting a chart type, choosing data series, and customizing the chart.Summer lecture 2
Summer lecture 2Zahida Pervaiz
╠²
The document discusses exploratory data analysis techniques, specifically the stem-and-leaf display. It provides an example of a stem-and-leaf display used to summarize cost of parts data from 50 auto tune-ups. The display arranges the data values in rank order with the first digit to the left of a vertical line and the next digit to the right, with single digits assumed to have a value of 1. This technique shows both the order and shape of the distribution of the original quantitative data values.Backward difference
Backward differenceshakihp
╠²
The document discusses backward difference, which is a method used in interpolation and numerical integration of functions. It involves taking the difference between function values at equally spaced points, working backward from the last point. The first backward difference is between the last two points, the second is the difference between the first differences, and so on. An example calculates the backward differences for a set of data points and uses the formula to interpolate the function value at x=42.Tutorial how to make and use a standard curve gel electrophoresis
Tutorial how to make and use a standard curve gel electrophoresiskcangial
╠²
1. To determine the size of DNA fragments on a gel, a standard curve is made by measuring the distance migrated of DNA standards of known sizes, taking the log of the sizes, plotting against the distances, and fitting a linear trendline.
2. For unknown samples, the distance migrated is measured and used to calculate the corresponding log size using the trendline equation.
3. The antilog is taken to determine the fragment size in base pairs. A quality check is recommended to validate the size calculation makes scientific sense.Excel2002
Excel2002Padma Kannan
╠²
This document provides instructions on using Excel's Chart Wizard to create charts. It describes the steps to use the Chart Wizard, including selecting a chart type in the first dialog box, choosing the data series and range in the second dialog box, customizing the appearance in the third dialog box, and specifying the chart location in the fourth dialog box. The Chart Wizard guides the user through the process of defining the chart type, data, and design.Excel2002
Excel2002Osama Zain
╠²
This document provides instructions on using Excel's Chart Wizard to create charts. It describes the steps to use the Chart Wizard, including selecting a chart type in the first dialog box, choosing the data series and range in the second dialog box, customizing the appearance in the third dialog box, and specifying the chart location in the final dialog box. The Chart Wizard makes it easy to generate charts in Excel with a series of prompts to guide the user through the process.Population Standard Deviation - Desk Work 7
Population Standard Deviation - Desk Work 7ccooking
╠²
The document provides steps to calculate the population standard deviation of the dataset {18, 19, 19, 25, 28, 35}:
1) The mean (╬╝) of the dataset is calculated to be 24.
2) Deviations from the mean (x - ╬╝) are calculated and squared.
3) The squared deviations are summed to get a total of 224.
4) The population standard deviation (Žā) is calculated by dividing the sum of squared deviations by the number of values in the dataset, which is 6, resulting in a population standard deviation of 1.6.Introduction to Regression Analysis
Introduction to Regression AnalysisMinha Hwang
╠²
- The class outline covers regression analysis, including determining the R-squared value and interpreting regression output from Excel.
- Regression models the relationship between a dependent variable (sales) and independent variables (price and other factors) using estimated coefficients.
- The R-squared value measures the explanatory power of the regression model, with higher values indicating more of the variation in the dependent variable is explained by the independent variables.
- Excel can be used to perform the regression analysis and output statistics including coefficients, F-statistics from the ANOVA table, and p-values to interpret the significance of each coefficient.Measuring risk essentials of financial risk management
Measuring risk essentials of financial risk managementChho Phet
╠²
The document discusses various methods of measuring financial risk. It covers measures of exposure like risk exposure calculations, gap analysis, and stress testing. It then discusses value-at-risk (VaR) as a common measure of market risk, how it estimates potential portfolio losses based on historical data, and how it can be calculated using variance-covariance models or historical simulation. Monte Carlo simulation is also mentioned as another technique for calculating VaR.analysis of Investment option available in market 
analysis of Investment option available in market Kalakar Chokro
╠²
Optima Money Managers Pvt Ltd is an Indian financial services firm that provides wealth management, financial planning, tax, and business advisory services to individuals and small businesses. It aims to help clients achieve their financial goals and mitigate risks through customized solutions. The company is managed by experienced professionals like CAs, CFPs, and MBAs. It prides itself on providing high-quality advice and service. For individuals, the company assists with goals like retirement planning, tax planning, and estate planning. For small businesses, it offers consulting, internal auditing, and cost management services.Correlation and Regression Analysis using SPSS and Microsoft Excel
Correlation and Regression Analysis using SPSS and Microsoft ExcelSetia Pramana
╠²
This document discusses correlation and linear regression analysis. It covers correlation coefficients, linear relationships between variables, assumptions of linear regression, and using SPSS and Excel to conduct correlation and regression analyses. Pearson and Spearman correlation coefficients are introduced as measures of the linear association between two continuous variables. Simple and multiple linear regression models are explained as tools to predict an outcome variable from one or more predictor variables.Measuring of risk
Measuring of riskDr. Anees Alyafei
╠²
This document discusses measures of association used in epidemiology to quantify the relationship between an exposure and disease. It defines key terms like relative risk, odds ratio, and attributable proportion. Relative risk compares the risk of disease between an exposed and unexposed group. Odds ratio makes a similar comparison but uses odds instead of probabilities. Attributable proportion estimates the percentage of disease risk in the exposed group that can be attributed to the exposure. Examples are provided to demonstrate calculating and interpreting each measure. Overall, the document outlines the main epidemiological measures used to determine the strength of association between an exposure and health outcome in a population.Investment Analysis Project Presentation
Investment Analysis Project Presentationnroopraj24
╠²
This document summarizes an investment analysis project from a finance class. The goals of the portfolio were to preserve capital during a recessionary period in 2009. The portfolio was diversified across multiple securities and had a beta of 0.29, lower than the market proxy, helping achieve the goal of capital preservation. Over 14 weeks, the portfolio value declined 3.07% while the market index rose 7.18%. Key concepts learned included diversification, market efficiency, and capital asset pricing model analysis. In conclusion, objectives and constraints like investment period are important considerations in portfolio formation and analysis.Measuring risk
Measuring riskGALAXY GLOBAL GROUP OF INSTITUTIONS
╠²
This document discusses various methods of measuring risk, including variance, standard deviation, skewness, kurtosis, and the components of risk such as project-specific risk, competitive risk, industry risk, market risk, and international risk. It then discusses the capital asset pricing model (CAPM) and how it uses beta to measure non-diversifiable risk and translate that into an expected return. The document provides an example of estimating beta for Disney stock.Analysis of investment decisions
Analysis of investment decisionsVaibhav Baitalwar
╠²
This document appears to be a student project report on analyzing investment decisions. It includes sections on declaring that the work is original, an abstract summarizing the project, acknowledgements of those who helped with the project, a table of contents, and an introduction on investment decisions and types of investment options. The report will analyze and compare different investment options such as equities, bonds, gold, mutual funds, real estate, and life insurance on parameters like returns, safety, liquidity, and risk over a 5 year period. It aims to help investors understand various options and choose investments suited to their goals and risk tolerance.Regression Analysis
Regression Analysisnadiazaheer
╠²
The document provides an overview of regression analysis concepts including:
- Regression analysis is used to understand relationships between variables and predict the value of one variable based on another.
- A regression model has a dependent variable on the y-axis and an independent variable on the x-axis.
- Examples of how to perform regression analysis are provided including creating a scatter plot and calculating parameters like the slope and intercept.
- Key concepts for measuring the fit of a linear regression model are defined including variability, correlation coefficient, coefficient of determination, and standard error.Investment Analysis Final Project
Investment Analysis Final Projectnroopraj24
╠²
This document analyzes an investment portfolio over 14 weeks from January 30, 2009 to May 1, 2009. The portfolio was managed with the goal of preserving capital given the economic recession. Key points:
- The portfolio was diversified across stocks, mutual funds, bonds, bills and held some cash. Individual securities like GE, McDonald's and Family Dollar were chosen for their lower beta and defensive nature.
- The portfolio beta was approximately 0.3, much lower than the market beta of 1, indicating it would be less volatile.
- The portfolio largely preserved capital, declining only 3.07% while the market rose 7.18%. The low beta strategy helped meet the goal of capital preservation in the volatileHarvard Management Company Investment Analysis
Harvard Management Company Investment Analysisbensigler
╠²
The document discusses Harvard Management Company's (HMC) consideration and adoption of inflation-linked bonds (TIPS) into its investment portfolio. It provides background on HMC and its goal of achieving a 6-7% average annual real return. It then explains what TIPS are and how they work, and analyzes their potential performance in different inflation scenarios. HMC ultimately recommended including a 7% allocation to TIPS in its portfolio to help hedge against inflation risk and improve risk-adjusted returns.Reporting a single linear regression in apa
Reporting a single linear regression in apaKen Plummer
╠²
The document provides a template for reporting the results of a simple linear regression analysis in APA format. It explains that a linear regression was conducted to predict weight based on height. The regression equation was found to be significant, F(1,14)=25.925, p<.000, with an R2 of .649. The predicted weight is equal to -234.681 + 5.434 (height in inches) pounds.3.10 3.11 Notes A
3.10 3.11 Notes Ambetzel
╠²
This document provides homework questions on solving equations and graphing equations. It includes:
1) Solving equations with one variable like 3x + 2 = 5x + 3 and determining the number of solutions.
2) Solving a two variable equation 2x + 3y = 12 and finding points that satisfy the equation.
3) Graphing equations like y = x^2 - 3x + 2 on a graphing calculator and determining features of the graph like where it crosses the x-axis.
4) Applying a transformation like (x,y) -> (x + 5, y) to the points on a graph.
5) Identifying points that do or do notPrecalculus 09 Matrices.pptx
Precalculus 09 Matrices.pptxKarloFritz
╠²
This document provides an overview of matrices and their applications. It begins with defining matrices and their order. It then discusses writing matrices in row echelon form and using augmented matrices to solve systems of linear equations. Subsequently, it covers Gaussian elimination, matrix operations, inverses, determinants, and various applications of matrices including Cramer's rule, finding the area of triangles, encoding messages, and more. Examples are provided throughout to illustrate each concept.Precalculus 09 Matrices.pptx
Precalculus 09 Matrices.pptxPiyaliBhar1
╠²
This document provides an overview of matrices and their applications. It begins with defining matrices and their order. It then discusses writing matrices in row echelon form and using augmented matrices to solve systems of linear equations. Subsequently, it covers Gaussian elimination, matrix operations, inverse matrices, determinants, and applications such as Cramer's rule, finding the area of a triangle, encoding messages, and more. The document serves as a tutorial with examples for understanding and working with matrices.Ch 5 book - systems of linear equations
Ch 5 book - systems of linear equationsSeptiya Wulandari
╠²
This document discusses solving systems of linear equations by graphing, substitution, and elimination. It provides examples of solving systems of linear equations graphically by finding the point of intersection of the lines. The document also discusses using tables, graphs, and graphing calculators to check solutions to systems of linear equations.Linear Regression Modeling
Linear Regression Modelingpetermanr22
╠²
1) Regression models analyze data to find patterns and relationships that can be used to predict future trends or values.
2) A linear regression finds the line of best fit to model the relationship between two variables in a data set.
3) The document demonstrates how to create a linear regression model by plotting sample data, determining the best fit line, calculating the line's slope and y-intercept, and writing the equation in slope-intercept form.April 13, 2015
April 13, 2015khyps13
╠²
This document contains information about a math class that is reviewing quadratic functions. It includes:
1. An outline of the class agenda which focuses on reviewing key concepts like how the b-value affects the parabola and completing classwork.
2. Details about grading which includes assignments, homework, tests, the final exam, and notebook checks.
3. Sample problems and class notes focused on quadratic functions, including the axis of symmetry, vertex, graphing techniques, and how changing a, b, and c values impacts the parabola.
4. Examples of completing the steps to graph quadratic functions like plotting points and reflecting over the axis of symmetry.Image Processing
Image Processingyuvhashree
╠²
This document provides an overview of the fundamentals of image processing. It begins with an introduction to key mathematical foundations, including vectors, matrices, vector spaces, bases, inner products, projections, and linear transforms. It then covers topics such as discrete-time signals and systems, linear time-invariant systems, sampling continuous signals to discrete and vice versa, digital filter design, image formation via lenses and sensors, point-wise and linear filtering operations, motion estimation, and useful tools like expectation-maximization and principal component analysis. The document serves as a guide to the core concepts and techniques in digital image processing.Nov. 16 Quadratic Inequalities
Nov. 16 Quadratic InequalitiesRyanWatt
╠²
This document discusses two methods for solving quadratic inequalities: graphing and using a sign diagram. For graphing, the inequality is graphed like a boundary line and the range where the inequality is true is shaded. For the sign diagram method, the zeros of the quadratic function are placed on a number line and the intervals where the function has the same sign as the inequality are determined to be the solution set. Examples of both methods are shown and key aspects like critical numbers and sign changes are explained.Using microsoft excel for weibull analysis
Using microsoft excel for weibull analysisMelvin Carter
╠²
A simple introduction to reliability analysis of components. Though this lacks explanations of the calculated steps it shows how simple analysis can be. Note that it only addresses the Weibull distribution. It does share how to look elsewhere if the Weibull shape parameter is not near the ideal three(3).MS_Excel_Module4.1 ffor beginners yo .pptx
MS_Excel_Module4.1 ffor beginners yo .pptxshagunjain2k22phdcs0
╠²
SQL, or Structured Query Language, is a powerful and versatile programming language used for managing and manipulating relational databases. With its intuitive syntax and wide-ranging capabilities, SQL has become a cornerstone of modern data management systems, enabling users to interact with databases efficiently and effectively.
One of the primary functions of SQL is to retrieve data from databases using queries. These queries allow users to specify the data they want to retrieve, filter it based on certain criteria, and perform various operations on it. SQL queries typically consist of several components, including:
1. **SELECT statement**: The SELECT statement is used to specify the columns of data that should be retrieved from the database. It allows users to choose which fields they want to include in the query's results.
2. **FROM clause**: The FROM clause specifies the table or tables from which the data should be retrieved. It identifies the source of the data for the query.
3. **WHERE clause**: The WHERE clause is used to filter the data based on specific conditions. It allows users to narrow down the results of their query by specifying criteria that must be met by the data.
4. **JOIN clause**: The JOIN clause is used to combine data from multiple tables in a database. It allows users to create relationships between tables based on common fields and retrieve data that spans multiple tables.
5. **GROUP BY clause**: The GROUP BY clause is used to group the results of a query based on one or more columns. It allows users to aggregate data and perform calculations on groups of records rather than individual records.
6. **HAVING clause**: The HAVING clause is used in conjunction with the GROUP BY clause to filter groups of data based on specific conditions. It allows users to apply conditions to groups of records after they have been grouped by the GROUP BY clause.
7. **ORDER BY clause**: The ORDER BY clause is used to sort the results of a query based on one or more columns. It allows users to specify the order in which the data should be displayed.
SQL also provides a wide range of functions and operators for performing calculations, manipulating strings and dates, and performing various other tasks. These functions and operators enhance the flexibility and power of SQL queries, enabling users to perform complex operations on their data with ease.
In addition to querying data, SQL is also used for managing database structures, creating and modifying tables, defining relationships between tables, and enforcing constraints to maintain data integrity. SQL's data definition language (DDL) allows users to create, alter, and drop database objects such as tables, indexes, and views, while its data manipulation language (DML) allows users to insert, update, delete, and retrieve data from tables.
Overall, SQL is a fundamental tool for working with relational databases, providing users with the ability to retrieve, manipulate, and manageMore Related Content
Viewers also liked (12)
Introduction to Regression Analysis
Introduction to Regression AnalysisMinha Hwang
╠²
- The class outline covers regression analysis, including determining the R-squared value and interpreting regression output from Excel.
- Regression models the relationship between a dependent variable (sales) and independent variables (price and other factors) using estimated coefficients.
- The R-squared value measures the explanatory power of the regression model, with higher values indicating more of the variation in the dependent variable is explained by the independent variables.
- Excel can be used to perform the regression analysis and output statistics including coefficients, F-statistics from the ANOVA table, and p-values to interpret the significance of each coefficient.Measuring risk essentials of financial risk management
Measuring risk essentials of financial risk managementChho Phet
╠²
The document discusses various methods of measuring financial risk. It covers measures of exposure like risk exposure calculations, gap analysis, and stress testing. It then discusses value-at-risk (VaR) as a common measure of market risk, how it estimates potential portfolio losses based on historical data, and how it can be calculated using variance-covariance models or historical simulation. Monte Carlo simulation is also mentioned as another technique for calculating VaR.analysis of Investment option available in market
analysis of Investment option available in market Kalakar Chokro
╠²
Optima Money Managers Pvt Ltd is an Indian financial services firm that provides wealth management, financial planning, tax, and business advisory services to individuals and small businesses. It aims to help clients achieve their financial goals and mitigate risks through customized solutions. The company is managed by experienced professionals like CAs, CFPs, and MBAs. It prides itself on providing high-quality advice and service. For individuals, the company assists with goals like retirement planning, tax planning, and estate planning. For small businesses, it offers consulting, internal auditing, and cost management services.Correlation and Regression Analysis using SPSS and Microsoft Excel
Correlation and Regression Analysis using SPSS and Microsoft ExcelSetia Pramana
╠²
This document discusses correlation and linear regression analysis. It covers correlation coefficients, linear relationships between variables, assumptions of linear regression, and using SPSS and Excel to conduct correlation and regression analyses. Pearson and Spearman correlation coefficients are introduced as measures of the linear association between two continuous variables. Simple and multiple linear regression models are explained as tools to predict an outcome variable from one or more predictor variables.Measuring of risk
Measuring of riskDr. Anees Alyafei
╠²
This document discusses measures of association used in epidemiology to quantify the relationship between an exposure and disease. It defines key terms like relative risk, odds ratio, and attributable proportion. Relative risk compares the risk of disease between an exposed and unexposed group. Odds ratio makes a similar comparison but uses odds instead of probabilities. Attributable proportion estimates the percentage of disease risk in the exposed group that can be attributed to the exposure. Examples are provided to demonstrate calculating and interpreting each measure. Overall, the document outlines the main epidemiological measures used to determine the strength of association between an exposure and health outcome in a population.Investment Analysis Project Presentation
Investment Analysis Project Presentationnroopraj24
╠²
This document summarizes an investment analysis project from a finance class. The goals of the portfolio were to preserve capital during a recessionary period in 2009. The portfolio was diversified across multiple securities and had a beta of 0.29, lower than the market proxy, helping achieve the goal of capital preservation. Over 14 weeks, the portfolio value declined 3.07% while the market index rose 7.18%. Key concepts learned included diversification, market efficiency, and capital asset pricing model analysis. In conclusion, objectives and constraints like investment period are important considerations in portfolio formation and analysis.Measuring risk
Measuring riskGALAXY GLOBAL GROUP OF INSTITUTIONS
╠²
This document discusses various methods of measuring risk, including variance, standard deviation, skewness, kurtosis, and the components of risk such as project-specific risk, competitive risk, industry risk, market risk, and international risk. It then discusses the capital asset pricing model (CAPM) and how it uses beta to measure non-diversifiable risk and translate that into an expected return. The document provides an example of estimating beta for Disney stock.Analysis of investment decisions
Analysis of investment decisionsVaibhav Baitalwar
╠²
This document appears to be a student project report on analyzing investment decisions. It includes sections on declaring that the work is original, an abstract summarizing the project, acknowledgements of those who helped with the project, a table of contents, and an introduction on investment decisions and types of investment options. The report will analyze and compare different investment options such as equities, bonds, gold, mutual funds, real estate, and life insurance on parameters like returns, safety, liquidity, and risk over a 5 year period. It aims to help investors understand various options and choose investments suited to their goals and risk tolerance.Regression Analysis
Regression Analysisnadiazaheer
╠²
The document provides an overview of regression analysis concepts including:
- Regression analysis is used to understand relationships between variables and predict the value of one variable based on another.
- A regression model has a dependent variable on the y-axis and an independent variable on the x-axis.
- Examples of how to perform regression analysis are provided including creating a scatter plot and calculating parameters like the slope and intercept.
- Key concepts for measuring the fit of a linear regression model are defined including variability, correlation coefficient, coefficient of determination, and standard error.Investment Analysis Final Project
Investment Analysis Final Projectnroopraj24
╠²
This document analyzes an investment portfolio over 14 weeks from January 30, 2009 to May 1, 2009. The portfolio was managed with the goal of preserving capital given the economic recession. Key points:
- The portfolio was diversified across stocks, mutual funds, bonds, bills and held some cash. Individual securities like GE, McDonald's and Family Dollar were chosen for their lower beta and defensive nature.
- The portfolio beta was approximately 0.3, much lower than the market beta of 1, indicating it would be less volatile.
- The portfolio largely preserved capital, declining only 3.07% while the market rose 7.18%. The low beta strategy helped meet the goal of capital preservation in the volatileHarvard Management Company Investment Analysis
Harvard Management Company Investment Analysisbensigler
╠²
The document discusses Harvard Management Company's (HMC) consideration and adoption of inflation-linked bonds (TIPS) into its investment portfolio. It provides background on HMC and its goal of achieving a 6-7% average annual real return. It then explains what TIPS are and how they work, and analyzes their potential performance in different inflation scenarios. HMC ultimately recommended including a 7% allocation to TIPS in its portfolio to help hedge against inflation risk and improve risk-adjusted returns.Reporting a single linear regression in apa
Reporting a single linear regression in apaKen Plummer
╠²
The document provides a template for reporting the results of a simple linear regression analysis in APA format. It explains that a linear regression was conducted to predict weight based on height. The regression equation was found to be significant, F(1,14)=25.925, p<.000, with an R2 of .649. The predicted weight is equal to -234.681 + 5.434 (height in inches) pounds.Similar to AMCA Excel Regression (guide) (11)
3.10 3.11 Notes A
3.10 3.11 Notes Ambetzel
╠²
This document provides homework questions on solving equations and graphing equations. It includes:
1) Solving equations with one variable like 3x + 2 = 5x + 3 and determining the number of solutions.
2) Solving a two variable equation 2x + 3y = 12 and finding points that satisfy the equation.
3) Graphing equations like y = x^2 - 3x + 2 on a graphing calculator and determining features of the graph like where it crosses the x-axis.
4) Applying a transformation like (x,y) -> (x + 5, y) to the points on a graph.
5) Identifying points that do or do notPrecalculus 09 Matrices.pptx
Precalculus 09 Matrices.pptxKarloFritz
╠²
This document provides an overview of matrices and their applications. It begins with defining matrices and their order. It then discusses writing matrices in row echelon form and using augmented matrices to solve systems of linear equations. Subsequently, it covers Gaussian elimination, matrix operations, inverses, determinants, and various applications of matrices including Cramer's rule, finding the area of triangles, encoding messages, and more. Examples are provided throughout to illustrate each concept.Precalculus 09 Matrices.pptx
Precalculus 09 Matrices.pptxPiyaliBhar1
╠²
This document provides an overview of matrices and their applications. It begins with defining matrices and their order. It then discusses writing matrices in row echelon form and using augmented matrices to solve systems of linear equations. Subsequently, it covers Gaussian elimination, matrix operations, inverse matrices, determinants, and applications such as Cramer's rule, finding the area of a triangle, encoding messages, and more. The document serves as a tutorial with examples for understanding and working with matrices.Ch 5 book - systems of linear equations
Ch 5 book - systems of linear equationsSeptiya Wulandari
╠²
This document discusses solving systems of linear equations by graphing, substitution, and elimination. It provides examples of solving systems of linear equations graphically by finding the point of intersection of the lines. The document also discusses using tables, graphs, and graphing calculators to check solutions to systems of linear equations.Linear Regression Modeling
Linear Regression Modelingpetermanr22
╠²
1) Regression models analyze data to find patterns and relationships that can be used to predict future trends or values.
2) A linear regression finds the line of best fit to model the relationship between two variables in a data set.
3) The document demonstrates how to create a linear regression model by plotting sample data, determining the best fit line, calculating the line's slope and y-intercept, and writing the equation in slope-intercept form.April 13, 2015
April 13, 2015khyps13
╠²
This document contains information about a math class that is reviewing quadratic functions. It includes:
1. An outline of the class agenda which focuses on reviewing key concepts like how the b-value affects the parabola and completing classwork.
2. Details about grading which includes assignments, homework, tests, the final exam, and notebook checks.
3. Sample problems and class notes focused on quadratic functions, including the axis of symmetry, vertex, graphing techniques, and how changing a, b, and c values impacts the parabola.
4. Examples of completing the steps to graph quadratic functions like plotting points and reflecting over the axis of symmetry.Image Processing
Image Processingyuvhashree
╠²
This document provides an overview of the fundamentals of image processing. It begins with an introduction to key mathematical foundations, including vectors, matrices, vector spaces, bases, inner products, projections, and linear transforms. It then covers topics such as discrete-time signals and systems, linear time-invariant systems, sampling continuous signals to discrete and vice versa, digital filter design, image formation via lenses and sensors, point-wise and linear filtering operations, motion estimation, and useful tools like expectation-maximization and principal component analysis. The document serves as a guide to the core concepts and techniques in digital image processing.Nov. 16 Quadratic Inequalities
Nov. 16 Quadratic InequalitiesRyanWatt
╠²
This document discusses two methods for solving quadratic inequalities: graphing and using a sign diagram. For graphing, the inequality is graphed like a boundary line and the range where the inequality is true is shaded. For the sign diagram method, the zeros of the quadratic function are placed on a number line and the intervals where the function has the same sign as the inequality are determined to be the solution set. Examples of both methods are shown and key aspects like critical numbers and sign changes are explained.Using microsoft excel for weibull analysis
Using microsoft excel for weibull analysisMelvin Carter
╠²
A simple introduction to reliability analysis of components. Though this lacks explanations of the calculated steps it shows how simple analysis can be. Note that it only addresses the Weibull distribution. It does share how to look elsewhere if the Weibull shape parameter is not near the ideal three(3).MS_Excel_Module4.1 ffor beginners yo .pptx
MS_Excel_Module4.1 ffor beginners yo .pptxshagunjain2k22phdcs0
╠²
SQL, or Structured Query Language, is a powerful and versatile programming language used for managing and manipulating relational databases. With its intuitive syntax and wide-ranging capabilities, SQL has become a cornerstone of modern data management systems, enabling users to interact with databases efficiently and effectively.
One of the primary functions of SQL is to retrieve data from databases using queries. These queries allow users to specify the data they want to retrieve, filter it based on certain criteria, and perform various operations on it. SQL queries typically consist of several components, including:
1. **SELECT statement**: The SELECT statement is used to specify the columns of data that should be retrieved from the database. It allows users to choose which fields they want to include in the query's results.
2. **FROM clause**: The FROM clause specifies the table or tables from which the data should be retrieved. It identifies the source of the data for the query.
3. **WHERE clause**: The WHERE clause is used to filter the data based on specific conditions. It allows users to narrow down the results of their query by specifying criteria that must be met by the data.
4. **JOIN clause**: The JOIN clause is used to combine data from multiple tables in a database. It allows users to create relationships between tables based on common fields and retrieve data that spans multiple tables.
5. **GROUP BY clause**: The GROUP BY clause is used to group the results of a query based on one or more columns. It allows users to aggregate data and perform calculations on groups of records rather than individual records.
6. **HAVING clause**: The HAVING clause is used in conjunction with the GROUP BY clause to filter groups of data based on specific conditions. It allows users to apply conditions to groups of records after they have been grouped by the GROUP BY clause.
7. **ORDER BY clause**: The ORDER BY clause is used to sort the results of a query based on one or more columns. It allows users to specify the order in which the data should be displayed.
SQL also provides a wide range of functions and operators for performing calculations, manipulating strings and dates, and performing various other tasks. These functions and operators enhance the flexibility and power of SQL queries, enabling users to perform complex operations on their data with ease.
In addition to querying data, SQL is also used for managing database structures, creating and modifying tables, defining relationships between tables, and enforcing constraints to maintain data integrity. SQL's data definition language (DDL) allows users to create, alter, and drop database objects such as tables, indexes, and views, while its data manipulation language (DML) allows users to insert, update, delete, and retrieve data from tables.
Overall, SQL is a fundamental tool for working with relational databases, providing users with the ability to retrieve, manipulate, and manage
Recently uploaded (20)
BIDA Summit Presentation_Ashik Chowdhury.pptx
BIDA Summit Presentation_Ashik Chowdhury.pptxJaneMama
╠²
At the Investment Summit 2025, BIDA Chairman Chowdhury Ashik Mahmud Bin Harun shared a forward-looking vision of Bangladesh as a regional manufacturing hub by 2035, emphasizing the strength of its young population, expanding domestic market, and ongoing policy reforms. He called on investors to see beyond financial returns and join Bangladesh in its broader journey of transformation and growth, citing 100 years of successful business operations in Bangladesh's economic history.Veronika Myltseva: ą£č¢ąČąĮą░čĆąŠą┤ąĮč¢ čéčĆąĄąĮą┤ąĖ čĆąĄą│čāą╗čÄą▓ą░ąĮąĮčÅ ą©ąå: čēąŠ ą▓ą░ąČą╗ąĖą▓ąŠ ąĘąĮą░čéąĖ ą▒č¢ąĘąĮąĄčüčā...
Veronika Myltseva: ą£č¢ąČąĮą░čĆąŠą┤ąĮč¢ čéčĆąĄąĮą┤ąĖ čĆąĄą│čāą╗čÄą▓ą░ąĮąĮčÅ ą©ąå: čēąŠ ą▓ą░ąČą╗ąĖą▓ąŠ ąĘąĮą░čéąĖ ą▒č¢ąĘąĮąĄčüčā...Lviv Startup Club
╠²
Veronika Myltseva: ą£č¢ąČąĮą░čĆąŠą┤ąĮč¢ čéčĆąĄąĮą┤ąĖ čĆąĄą│čāą╗čÄą▓ą░ąĮąĮčÅ ą©ąå: čēąŠ ą▓ą░ąČą╗ąĖą▓ąŠ ąĘąĮą░čéąĖ ą▒č¢ąĘąĮąĄčüčā čüčīąŠą│ąŠą┤ąĮč¢ (UA)
AI & BigData Online Day 2025 Spring
Website ŌĆō https://aiconf.com.ua
Youtube ŌĆō https://www.youtube.com/startuplviv
FB ŌĆō https://www.facebook.com/aiconf/Lion One Metals Corporate Presentation April 2025
Lion One Metals Corporate Presentation April 2025Adnet Communications
╠²
Lion One Metals Corporate Presentation April 2025
Beyond the Basics: Flow, Forecasting & Decision-Making
Beyond the Basics: Flow, Forecasting & Decision-MakingOrderly Disruption
╠²
Mentimeter slides for Kanban Beyond the Basics: Flow, Forecasting & Decision-Making
Project Management Conference
Agility in the era of AI
April 3rd ŌĆō 4th, 2025 | OTEAcademy ╬æuditorium
Navigating Emerging Technologies in Business
Navigating Emerging Technologies in BusinessArik Fletcher
╠²
A framework for evaluating and implementing new technologies, with case studies on high-profile successes and failures.Professional Business Report Presentation.pptx.pptx
Professional Business Report Presentation.pptx.pptxJundil Galamiton
╠²
global connect & its parts, uses, hindranceOleksii Ivanchenko: Generative AI architecture patterns in production (UA)
Oleksii Ivanchenko: Generative AI architecture patterns in production (UA)Lviv Startup Club
╠²
Oleksii Ivanchenko: Generative AI architecture patterns in production (UA)
AI & BigData Online Day 2025 Spring
Website ŌĆō https://aiconf.com.ua
Youtube ŌĆō https://www.youtube.com/startuplviv
FB ŌĆō https://www.facebook.com/aiconf/Event Report - Google Cloud Next 2025 - Google Cloud completes and leads
Event Report - Google Cloud Next 2025 - Google Cloud completes and leadsHolger Mueller
╠²
I had the opportunity to attend Google Cloud Next, held in Las Vegas at the Mandalay Bay Convention Center in Las Vegas from April 8th till 11th 2025. Google Cloud shows an impressive advance on infrastrucure and platform side. Google Cloud builds out its positon as leader for AI powered Next Generation Applications. Google makes agent creation easier, brings them to on premises with GDC, partners with Nvidia for GPUs on premises. Cloud WAN opens the Google Network, another differentiator. On the PaaS side, AlloyDB gains capabilties and is available via 3rd party on other clouds as well. Firestore gets MongoDB compatibility, Oracle @Google Cloud shows traction, and developers get access for Gemini across Firebase Studio. IAB-Ad-Funding-Online-Services-Report-2025-FINAL.pdf
IAB-Ad-Funding-Online-Services-Report-2025-FINAL.pdfagatadrynko
╠²
IAB-Ad-Funding-Online-Services-Report-2025-FINAL.pdfChina Business Expeditions June 2025.pdf
China Business Expeditions June 2025.pdfIreland in China
╠²
In an era of resurgent protectionism and volatile trade relations, marked by the escalating impact of Trump-era tariffs, China is delivering a clear, confident message to the global business community: its doors are opening even wider ŌĆö and the world is welcome.
That message comes to life from June 15th to June 21st, 2025, at what is widely considered ChinaŌĆÖs most significant international business event of 2025 ŌĆö the China Business Expeditions, featuring the Global Sourcing & Investment Summit (GSIS) and exclusive Dalian Business Engagements.
Taking place across strategic economic zones ŌĆö Beijing, Langfang, Tianjin, and Dalian ŌĆö and hosted by ChinaŌĆÖs most influential commercial institutions, including the Ministry of Commerce of the PeopleŌĆÖs Republic of China (MOFCOM), the China Council for the Promotion of International Trade (CCPIT), and the Dalian Commerce Bureau, the summit isnŌĆÖt just about connecting people ŌĆö itŌĆÖs about redefining global trade dynamics.
As global commerce undergoes a strategic realignment, with companies worldwide seeking reliable, scalable, and politically stable trade partners, GSIS 2025 offers a timely and compelling solution: engage directly with China, the worldŌĆÖs most advanced and adaptive manufacturing and innovation powerhouse.
For Irish and European firms facing a potential Ōé¼6 billion loss in transatlantic trade, this is more than an invitation ŌĆö itŌĆÖs a lifeline. China offers not just a market, but a partnership model rooted in opportunity, policy alignment, and long-term growth.
From personalized matchmaking with top-tier Chinese suppliers to high-level government engagements, GSIS 2025 is a gateway to resilience, expansion, and strategic positioning in an increasingly multipolar economic world.
For forward-looking business leaders, the message is unmistakable: donŌĆÖt get caught between global tensions ŌĆö get ahead of them. Look east. Look to China.
Why Attend the Global Sourcing and investment summit june 2025
Connecting with Chinese suppliers and businesspeople means accessing new industries, building on core and distinctive competencies, and uncovering niche opportunitiesŌĆöhelping businesses diversify and stay competitive amid global uncertainty. Engaging with government officials provides insights into regulations, potential incentives, and strengthens trustŌĆöboth by reassuring foreign businesses and enhancing the credibility of local suppliers.Own Your Own AI Infrastructure that is Scalable, Affordable, and Secure!
Own Your Own AI Infrastructure that is Scalable, Affordable, and Secure!ideatoipo
╠²
Recorded on Friday, April 4, 2025.
In this video, the speaker discusses:
Why Now is the Time for Your Own AI Cluster:
Cut Costs: Avoid rising cloud expenses. Access powerful AI capabilities at a fraction of the cost snd achieve high-performance without recurring fees.
Data Control: Retain full ownership of your data and AI workloads. With built-in security and performance monitoring, your infrastructure is always protected and optimized.
Meet Your Budget: fully integrated, customizable, and budget-friendly alternative that allows businesses to deploy, manage, and scale their AI capabilities without the usual obstacles
Seamless Scalability: Easily scale with your business needs, providing flexibility without requiring in-house AI expertise.
All-in-One Solution: Fully integrated with GPU servers, storage, Linux pre-installed, and DHCP configuredŌĆöready for immediate use.
Future-Proof Your Business: Owning your AI cluster ensures you stay competitive in an AI-driven market, with the ability to innovate faster.
Get the perfect blend of affordability, control, and scalability -- the ideal solution for enterprises ready to embrace AI without breaking the bank!
The Quantea QAI Cluster presentation introduces a powerful, scalable, and cost-effective alternative to traditional cloud-based or proprietary AI infrastructure solutions. It positions Quantea as a champion of democratizing AI by making high-performance computing accessible to businesses of all sizes. Through a combination of modular design, affordable pricing, and built-in performance monitoring and security features, the QAI Cluster empowers organizations to deploy on-premises AI clusters that meet their specific GPU, storage, and operating system needsŌĆöwhile maintaining full control over their data.
The presentation showcases detailed cost comparisons against NVIDIA DGX Cluster and public cloud offerings (AWS and Google Cloud), illustrating how QAI Clusters can reduce total cost of ownership by 30ŌĆō50%. With flexible configurations starting from just 4 NVIDIA H100 GPUs and scaling to over 100 nodes with many GPUs, the system supports everything from early-stage experimentation to enterprise-scale AI workloads. The platform also emphasizes energy efficiency, ease of deployment, and compatibility with NVIDIA stacks, all while incorporating real-time performance monitoring and intrusion detection. Designed for industries ranging from healthcare to finance, the Quantea QAI Cluster is also fully integrated and preconfigured at all-in-one convenience and positioned as the intelligent path to owning your AI futureŌĆösecurely, affordably, and on your terms.
About the Speaker:
Nan Liu is the CEO of Quantea, a leading innovator in network packet data analytics and AI infrastructure. Realistic & High-Quality Sex Dolls ŌĆō YJL Sex Doll Factory
Realistic & High-Quality Sex Dolls ŌĆō YJL Sex Doll Factoryyjlsexdoll7
╠²
Discover lifelike, premium sex dolls crafted with care at YJL Sex Doll Factory. Our dolls offer unmatched realism, customization options, and discreet delivery. Designed for comfort, intimacy, and satisfaction, each doll meets the highest standards of quality and craftsmanship. Explore our collection today.Participation of Chinese citizens i .pdf
Participation of Chinese citizens i .pdfRbc Rbcua
╠²
Participation of Chinese citizens in combat operations within the Russian Armed ForcesRaman Bhaumik - A Junior Software Developer
Raman Bhaumik - A Junior Software DeveloperRaman Bhaumik
╠²
Raman Bhaumik is a Junior Software Developer passionate about technology and problem-solving. With expertise in Java, Python, JavaScript, and SQL, Raman has contributed to improving web application performance by 25%. Skilled in frameworks like React and Django, she is adept in API development, unit testing, and database optimization.CBV - GST Collection Report - March 2025.pdf
CBV - GST Collection Report - March 2025.pdfwriter28
╠²
GST collections for March 2025 surged 9.9% YoY to Ōé╣1.96 lakh croreŌĆöthe second-highest everŌĆödriven by strong trade activity (+13.56% import GST). Net collections rose 7.3% to Ōé╣1.76 lakh crore. FY25 GST mop-up at Ōé╣22.08 lakh crore (+9.4%) showcases sustained economic momentum. States saw varied trendsŌĆöBihar (+30%) & Tripura (+32%) outperformed, while Andhra Pradesh (-1%) & Manipur (-18%) declined. Domestic demand remains robust, but regional disparities warrant close monitoring.
Hiring WordPress Developers Best Practices and Key Consideration
Hiring WordPress Developers Best Practices and Key Considerationmarianjures
╠²
Hiring WordPress developers is essential for your business because WordPress powers over 40% of websites globally, offering a stable and flexible platform. From Zero to Funded: How Small Businesses Can Build Credibility Without Perso...
From Zero to Funded: How Small Businesses Can Build Credibility Without Perso...The Red Spectrum
╠²
Tired of being denied business funding because of your personal credit?
Learn exactly how to build strong business credit, unlock Net 30 vendor accounts, and secure financing ŌĆö all without using your SSN.
This step-by-step guide covers:
Ō£ģ Structuring your business properly
Ō£ģ Building business credit fast
Ō£ģ Accessing vendor tradelines
Ō£ģ Unlocking higher credit limits
Ō£ģ Protecting your financial future
Get the funding your business deserves ŌĆö on your terms.
¤æē Swipe through the guide and start your journey to financial freedom today.
¤öŚ www.theredspectrum.com
#BusinessCredit #RedSpectrum #Entrepreneurship #RedSpectrum #StartupFunding #Credit #Funding #SmallBusinessSuccess #Finance #Net30Accounts #ZeroToFunded
Jignesh Shah The Visionary Who Transformed India's Financial.pdf
Jignesh Shah The Visionary Who Transformed India's Financial.pdfJignesh Shah
╠²
From humble beginnings in Mumbai to leading some of the most reputed financial institutions, Jignesh Shah is a name that has left a lasting mark on Indian markets. The journey of Jignesh Shah is a story of vision, resilience, and determination. As an innovator, entrepreneur, and technology enthusiast, he revolutionised trading and initiated a new era of transformation in the country's financial sector.╠²Veronika Myltseva: ą£č¢ąČąĮą░čĆąŠą┤ąĮč¢ čéčĆąĄąĮą┤ąĖ čĆąĄą│čāą╗čÄą▓ą░ąĮąĮčÅ ą©ąå: čēąŠ ą▓ą░ąČą╗ąĖą▓ąŠ ąĘąĮą░čéąĖ ą▒č¢ąĘąĮąĄčüčā...
Veronika Myltseva: ą£č¢ąČąĮą░čĆąŠą┤ąĮč¢ čéčĆąĄąĮą┤ąĖ čĆąĄą│čāą╗čÄą▓ą░ąĮąĮčÅ ą©ąå: čēąŠ ą▓ą░ąČą╗ąĖą▓ąŠ ąĘąĮą░čéąĖ ą▒č¢ąĘąĮąĄčüčā...Lviv Startup Club
╠²
AMCA Excel Regression (guide)
- 1. Computing Regression using Excel 1
- 2. Make sure you have Data Analysis ŌĆ£Add-InŌĆØ already in your Excel 2
- 3. Select Regression 3
- 4. Select the cells and tick the relevant boxes 4
- 5. Summary output 5
- 6. Getting your chart and Regression Line 6
- 7. 7
- 8. Double click on the chart and pull down the options for Charts- select the chart option with the ŌĆśfxŌĆÖ 8
- 9. You will then get your regression line with the regression equation too. Check that your regression variables match with the table that has been generated earlier (see slide 5) 9
- 10. Forecast ŌĆó Substitute the next period ( in this case Yr 9) into the equation and solve ŌĆó y = 1024.8x + 292.75 ŌĆó Solve for X=9 10
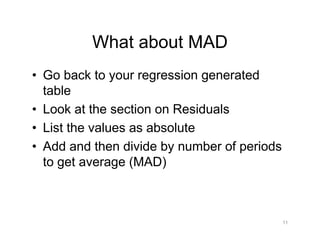
- 11. What about MAD ŌĆó Go back to your regression generated table ŌĆó Look at the section on Residuals ŌĆó List the values as absolute ŌĆó Add and then divide by number of periods to get average (MAD) 11
- 12. Residuals 12
- 13. Add the absolute values and divide by number of observations 13