


More Related Content
More from Biologia i Geologia (20)


Feina pendents 1r d’eso
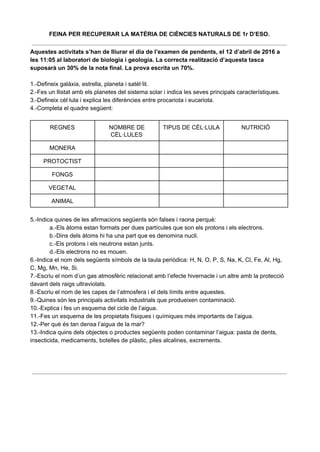
- 1. FEINAÌýPERÌýRECUPERARÌýLAÌýMATÈRIAÌýDEÌýCIÈNCIESÌýNATURALSÌýDEÌý1rÌýD’ESO.Ìý AquestesÌýactivitatsÌýs’hanÌýdeÌýlliurarÌýelÌýdiaÌýdeÌýl’examenÌýdeÌýpendents,ÌýelÌý12Ìýd’abrilÌýdeÌý2016ÌýaÌý lesÌý11:05ÌýalÌýlaboratoriÌýdeÌýbiologiaÌýiÌýgeologia.ÌýLaÌýcorrectaÌýrealitzacióÌýd’aquestaÌýtascaÌý suposarà ÌýunÌý30%ÌýdeÌýlaÌýnotaÌýfinal.ÌýLaÌýprovaÌýescritaÌýunÌý70%.Ìý Ìý 1.ÂDefineixÌýgalà xia,Ìýestrella,ÌýplanetaÌýiÌýsatèl∙lit.Ìý 2.ÂFesÌýunÌýllistatÌýambÌýelsÌýplanetesÌýdelÌýsistemaÌýsolarÌýiÌýindicaÌýlesÌýsevesÌýprincipalsÌýcaracterÃstiques.Ìý 3.ÂDefineixÌýcèl∙lulaÌýiÌýexplicaÌýlesÌýdiferènciesÌýentreÌýprocariotaÌýiÌýeucariota.Ìý 4.ÂCompletaÌýelÌýquadreÌýsegüent:Ìý Ìý REGNESÌý NOMBREÌýDEÌý CÈL∙LULESÌý TIPUSÌýDEÌýCÈL∙LULAÌý NUTRICIÓÌý MONERAÌý Ìý Ìý Ìý PROTOCTISTÌý Ìý Ìý Ìý FONGSÌý Ìý Ìý Ìý VEGETALÌý Ìý Ìý Ìý ANIMALÌý Ìý Ìý Ìý Ìý 5.ÂIndicaÌýquinesÌýdeÌýlesÌýafirmacionsÌýsegüentsÌýsónÌýfalsesÌýiÌýraonaÌýperquè:Ìý a.ÂElsÌýà tomsÌýestanÌýformatsÌýperÌýduesÌýpartÃculesÌýqueÌýsonÌýelsÌýprotonsÌýiÌýelsÌýelectrons.Ìý b.ÂDinsÌýdelsÌýà tomsÌýhiÌýhaÌýunaÌýpartÌýqueÌýesÌýdenominaÌýnucli.Ìý c.ÂElsÌýprotonsÌýiÌýelsÌýneutronsÌýestanÌýjunts.Ìý d.ÂElsÌýelectronsÌýnoÌýesÌýmouen.Ìý 6.ÂIndicaÌýelÌýnomÌýdelsÌýsegüentsÌýsÃmbolsÌýdeÌýlaÌýtaulaÌýperiòdica:ÌýH,ÌýN,ÌýO,ÌýP,ÌýS,ÌýNa,ÌýK,ÌýCl,ÌýFe,ÌýAl,ÌýHg,Ìý C,ÌýMg,ÌýMn,ÌýHe,ÌýSi.Ìý 7.ÂEscriuÌýelÌýnomÌýd’unÌýgasÌýatmosfèricÌýrelacionatÌýambÌýl’efecteÌýhivernacleÌýiÌýunÌýaltreÌýambÌýlaÌýproteccióÌý davantÌýdelsÌýraigsÌýultraviolats.Ìý 8.ÂEscriuÌýelÌýnomÌýdeÌýlesÌýcapesÌýdeÌýl’atmosferaÌýiÌýelÌýdelsÌýlÃmitsÌýentreÌýaquestes.Ìý 9.ÂQuinesÌýsónÌýlesÌýprincipalsÌýactivitatsÌýindustrialsÌýqueÌýprodueixenÌýcontaminació.Ìý 10.ÂExplicaÌýiÌýfesÌýunÌýesquemaÌýdelÌýcicleÌýdeÌýl’aigua.Ìý 11.ÂFesÌýunÌýesquemaÌýdeÌýlesÌýpropietatsÌýfÃsiquesÌýiÌýquÃmiquesÌýmésÌýimportantsÌýdeÌýl’aigua.Ìý 12.ÂPerÌýquèÌýésÌýtanÌýdensaÌýl’aiguaÌýdeÌýlaÌýmar?Ìý 13.ÂIndicaÌýquinsÌýdelsÌýobjectesÌýoÌýproductesÌýsegüentsÌýpodenÌýcontaminarÌýl’aigua:ÌýpastaÌýdeÌýdents,Ìý insecticida,Ìýmedicaments,ÌýbotellesÌýdeÌýplà stic,ÌýpilesÌýalcalines,Ìýexcrements.Ìý Ìý Ìý Ìý Ìý Ìý Ìý Ìý Ìý
- 2. 14.ÂDefineixÌýelÌýconcepteÌýdeÌýmineral.ÌýQuèÌýs’enténÌýperÌýmineraloide?Ìýposa’nÌýalgunÌýexempleÌýiÌýraonaÌýelÌý motiuÌýpelÌýqualÌýaquestsÌýmaterialsÌýnoÌýesÌýconsiderenÌýminerals.Ìý 15.ÂIndicaÌýlaÌýutilitatÌýqueÌýtenenÌýelsÌýmineralsÌýsegüents:Ìýgalena,Ìýcalcopirita,Ìýbauxita,Ìýuraninita,Ìýcinabri,Ìý hematies.Ìý 16.ÂQuèÌýésÌýl’escalaÌýdeÌýMohs?ÌýPerÌýaÌýqueÌýesÌýfaÌýservir?ÌýPosaÌýunÌýexempleÌýd’unÌýmineralÌýqueÌýsiguiÌýmoltÌý touÌýiÌýunÌýaltreÌýd’unÌýmineralÌýqueÌýsiguiÌýmoltÌýdur.Ìý 17.ÂIndicaÌýelsÌýgrupsÌýprincipalsÌýdeÌýroquesÌýatenentÌýalÌýseuÌýorigen.Ìý 18.ÂIndicaÌýquinÌýtipusÌýdeÌýrocaÌýesÌýformariaÌýperÌýaÌýcadaÌýunÌýdelsÌýprocessosÌýsegüents:ÌýlitificacióÌýdeÌý sediments,ÌýsolidificacióÌýd’unÌýmagmaÌýiÌýexposicióÌýaÌýfortesÌýpressions.Ìý 19.ÂDefineixÌýelÌýconcepteÌýdeÌýbiosfera.Ìý 20.ÂDefineixÌýelÌýtermeÌýbiodiversitat.Ìý 22.ÂExplicaÌýquèÌýésÌýunÌýésserÌýviuÌýiÌýenumeraÌýelsÌýprincipalsÌýgrupsÌýd’éssersÌývius.Ìý 23.ÂQuinesÌýsonÌýlesÌýtresÌýfuncionsÌývitalsÌýdelsÌýéssersÌývius?Ìý 24.ÂEscriuÌýunÌýexempleÌýd’unÌýésserÌýviuÌýautòtrofÌýiÌýunÌýaltreÌýd’heteròtrof.Ìý 25.ÂDefineixÌýquèÌýsónÌýlesÌýbiomolècules.Ìý 26.ÂEscriuÌýlesÌýpartsÌýqueÌýformenÌýunaÌýcèl∙lulaÌýeucariota.Ìý 27.ÂQuinesÌýsónÌýlesÌýestructuresÌýsegüentsÌýiÌýonÌýesÌýtroben?Ìýcloroplasts,ÌýparetÌývegetal,Ìýnucli,ÌýlisosomaÌýiÌý membranaÌýcel∙lular.ÌýQuinesÌýd’aquestesÌýpartsÌýsónÌýexclusivesÌýdeÌýlaÌýcèl∙lulaÌývegetal?Ìý 28.ÂDefineixÌýelÌýtermeÌýespècie.Ìý 29.ÂDefineixÌýelÌýtermeÌývegetal.Ìý 30.ÂCitaÌýelsÌýgrupsÌýdeÌývegetalsÌýmésÌýimportantsÌýiÌýesmentaÌýlesÌýsevesÌýcaracterÃstiques.Ìý 31.ÂEnumeraÌýelsÌýòrgansÌýdeÌýlaÌýplantaÌýqueÌýintervenenÌýenÌýlaÌýnutrició.Ìý 32.ÂExplicaÌýlaÌýdiferènciaÌýentreÌýsabaÌýbrutaÌýiÌýsabaÌýelaborada.Ìý 33.ÂDefineixÌýpol∙linitzacióÌýiÌýesmentaÌýelsÌýdiferentsÌýtipus.Ìý 34.ÂExplicaÌýlesÌýdiferentsÌýpartsÌýdeÌýlaÌýflor.Ìý 35.ÂExplicaÌýqueÌýésÌýunÌýinvertebrat.Ìý 36.ÂQuèÌýésÌýunÌýcelenterat?ÌýIÌýunÌýcuc?ÌýIÌýunÌýequinoderm?Ìý 37.ÂResumeixÌýlesÌýcaracterÃstiquesÌýdelsÌýprincipalsÌýgrupsÌýdeÌýmol∙luscsÌýiÌýd’artròpodes.Ìý 38.ÂDefineixÌýprotozouÌýiÌýalgaÌýiÌýposaÌýdosÌýexemplesÌýdeÌýcadascun.Ìý 39.ÂDibuixaÌýunÌýbacteriÌýiÌýunÌývirusÌýiÌýindicaÌýlesÌýparts.Ìý 40.ÂExplicaÌýlesÌýcaracterÃstiquesÌýdelsÌýdiferentsÌýtipusÌýdeÌýfongs.Ìý 41.ÂExplicaÌýlesÌýcaracterÃstiquesÌýdelsÌýdiferentsÌýgrupsÌýdeÌývertebrats.Ìý 42.ÂFesÌýunÌýdibuixÌýonÌýrepresentisÌýtotesÌýlesÌýcapesÌýexternesÌýdeÌýlaÌýTerraÌý(atmosfera,Ìýhidrosfera,Ìý biosfera,Ìýlitosfera)ÌýiÌýlesÌýinternesÌý(escorça,ÌýmantellÌýiÌýnucli)Ìý Ìý Ìý Ìý Ìý Ìý Ìý Ìý Ìý Ìý He rebut del departament de Biologia i Geologia el llistat d’activitats que he de lliurar el diaÌý Ìý Ìý Ìý Ìý Ìý Ìý Ìý Ìý Ìý Ìý Ìý Ìý Ìý Ìý Ìý Ìý 12 d’abril de 2016 a les 11:05 al laboratori de Biologia i Geologia, data de la realització deÌý Ìý Ìý Ìý Ìý Ìý Ìý Ìý Ìý Ìý Ìý Ìý Ìý Ìý Ìý Ìý Ìý Ìý l’examenÌýdeÌýpendentsÌýdeÌý1rÌýd’ESO.ÌýIÌýperÌýaÌýqueÌýconstiÌýsignoÌýaquestÌýlliurament:Ìý Nom:ÌýÌýÌýÌýÌýÌýÌýÌýÌýÌýÌýÌýÌýÌýÌýÌýÌýÌýÌýÌýÌýÌýÌýÌýÌýÌýÌýÌýÌýÌýÌýÌýÌýÌýÌýÌýÌýÌýÌýÌýÌýÌýÌýÌýÌýÌýÌýÌýÌýÌýÌýÌýÌýÌýÌýÌýÌýÌýÌýÌýÌýÌýÌýÌýÌýÌýSignatura:Ìý