際際滷

際際滷Share a Scribd company logo
3
Most read
4
Most read
Learning Intention:
To interpret pie
charts
What does the Pie Chart tell us?
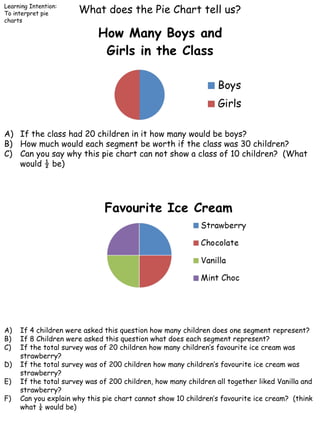
A) If the class had 20 children in it how many would be boys?
B) How much would each segment be worth if the class was 30 children?
C) Can you say why this pie chart can not show a class of 10 children? (What
would 遜 be)
A) If 4 children were asked this question how many children does one segment represent?
B) If 8 Children were asked this question what does each segment represent?
C) If the total survey was of 20 children how many childrens favourite ice cream was
strawberry?
D) If the total survey was of 200 children how many childrens favourite ice cream was
strawberry?
E) If the total survey was of 200 children, how many children all together liked Vanilla and
strawberry?
F) Can you explain why this pie chart cannot show 10 childrens favourite ice cream? (think
what 村 would be)
What does the Pie Chart tell us?
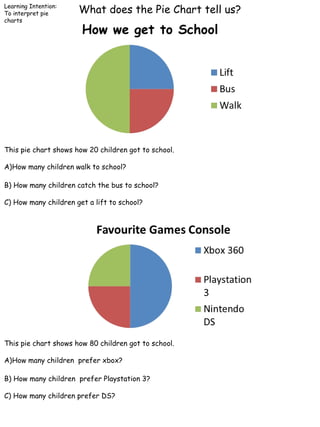
This pie chart shows how 20 children got to school.
A)How many children walk to school?
B) How many children catch the bus to school?
C) How many children get a lift to school?
This pie chart shows how 80 children got to school.
A)How many children prefer xbox?
B) How many children prefer Playstation 3?
C) How many children prefer DS?
Learning Intention:
To interpret pie
charts
Learning Intention:
To interpret pie
charts
What does the Pie Chart tell us?
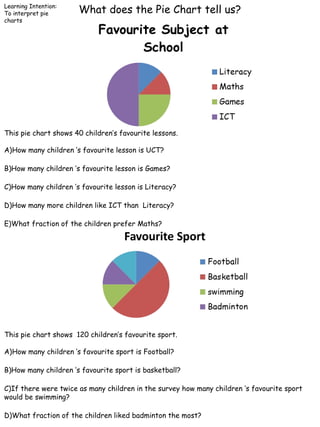
This pie chart shows 40 childrens favourite lessons.
A)How many children s favourite lesson is UCT?
B)How many children s favourite lesson is Games?
C)How many children s favourite lesson is Literacy?
D)How many more children like ICT than Literacy?
E)What fraction of the children prefer Maths?
This pie chart shows 120 childrens favourite sport.
A)How many children s favourite sport is Football?
B)How many children s favourite sport is basketball?
C)If there were twice as many children in the survey how many children s favourite sport
would be swimming?
D)What fraction of the children liked badminton the most?
Learning Intention:
To interpret pie
charts
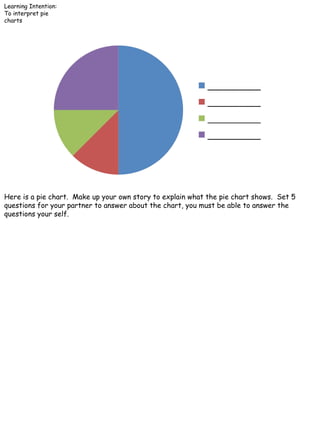
Here is a pie chart. Make up your own story to explain what the pie chart shows. Set 5
questions for your partner to answer about the chart, you must be able to answer the
questions your self.
More Related Content

Similar to Interpreting simple pie_charts (20)

PPTX
Interpreting data (Pie Graph).pptx
JinkyFlores3
PPTX
Interpreting data (Pie Graph)for mathematics grade 6 quarter 4
JUNARDIGUEL
PPTX
Interpreting data (Pie Graph).pptx
JennylynUrmenetaMacn
PPTX
Interpreting data presented in a pie graph
JuanitaNavarro4
PPTX
MATHEMATICS 6 PPT Q4 W6 - Interprets Data Presented In A Pie Graph..pptxbh;g,...
irishjoytoribio
PPTX
Dissiminating Information through displaying data.pptx
RealynTolentinoDeVil
PPTX
DISSEMINATING INFORMATION FROM SURVEYS.pptx
Ana Grace Millendez
PPTX
Pie Chart
Sonal Bharal
DOC
Lit lesson
kmedloc1
DOC
Lit lesson
kmedloc1
PPT
Statisics task fian's group
SMP N 2 Sindang Indramayu
PAGES
Lit lesson
kmedloc1
PPT
Statiska
Fian Ispianto
PDF
Jack
yajenel
PDF
Jack
yajenel
PPTX
Graph power point chestnut 2014 ccu
kimchestnutgc
PPTX
pie chart.pptx
samsam218603
PPTX
smart charts and graphs
Pushpitaray
PDF
TypesofGraphs.pdf Types of graphs Bar graph Picture chart Pie chart Tally chart
JohnVarghese491347
PPT
Frequency tables and pie charts constructing and questions
Malini Sharma
Interpreting data (Pie Graph).pptx
JinkyFlores3
Interpreting data (Pie Graph)for mathematics grade 6 quarter 4
JUNARDIGUEL
Interpreting data (Pie Graph).pptx
JennylynUrmenetaMacn
Interpreting data presented in a pie graph
JuanitaNavarro4
MATHEMATICS 6 PPT Q4 W6 - Interprets Data Presented In A Pie Graph..pptxbh;g,...
irishjoytoribio
Dissiminating Information through displaying data.pptx
RealynTolentinoDeVil
DISSEMINATING INFORMATION FROM SURVEYS.pptx
Ana Grace Millendez
Pie Chart
Sonal Bharal
Lit lesson
kmedloc1
Lit lesson
kmedloc1
Statisics task fian's group
SMP N 2 Sindang Indramayu
Lit lesson
kmedloc1
Statiska
Fian Ispianto
Jack
yajenel
Jack
yajenel
Graph power point chestnut 2014 ccu
kimchestnutgc
pie chart.pptx
samsam218603
smart charts and graphs
Pushpitaray
TypesofGraphs.pdf Types of graphs Bar graph Picture chart Pie chart Tally chart
JohnVarghese491347
Frequency tables and pie charts constructing and questions
Malini Sharma

More from Worserbay (20)

PPT
Paul klee
Worserbay
PPT
Factorsprimessquare
Worserbay
PPT
Divisibility rules
Worserbay
PPT
Square roots cube_roots
Worserbay
PPT
Mrodd mrseven (1)
Worserbay
DOC
Odd and even_numbers
Worserbay
PPT
Greaterthanorlessthan
Worserbay
PPT
Country temperatures
Worserbay
PPT
Greater less
Worserbay
PPT
Order the numbers
Worserbay
PPT
Fibonacci sequence
Worserbay
PPT
Y5 t2u11 numbersequences
Worserbay
PPT
Code crackers
Worserbay
PPT
Number sequences
Worserbay
PPT
Counting on and_back_y3
Worserbay
PPT
Sequences
Worserbay
PPT
Understanding negative numbers
Worserbay
PPT
Counting on a_100_square
Worserbay
PPT
Counting in100stornado
Worserbay
PPT
Counting in50svolcanotheme
Worserbay
Paul klee
Worserbay
Factorsprimessquare
Worserbay
Divisibility rules
Worserbay
Square roots cube_roots
Worserbay
Mrodd mrseven (1)
Worserbay
Odd and even_numbers
Worserbay
Greaterthanorlessthan
Worserbay
Country temperatures
Worserbay
Greater less
Worserbay
Order the numbers
Worserbay
Fibonacci sequence
Worserbay
Y5 t2u11 numbersequences
Worserbay
Code crackers
Worserbay
Number sequences
Worserbay
Counting on and_back_y3
Worserbay
Sequences
Worserbay
Understanding negative numbers
Worserbay
Counting on a_100_square
Worserbay
Counting in100stornado
Worserbay
Counting in50svolcanotheme
Worserbay
Ad

Recently uploaded (12)

PDF
KK KLUB
zukkunft
PPTX
Personal Safety for Women - 12 Reasons Why Women Stay in An Abusive Relations...
Robert Kaiser
PPTX
Extended_Colorful_Presentation_with_Icons.pptx
w6pvzbjp7m
PPTX
Psychosocial support activity emotion space.pptx
AnnaMae39
PDF
The Let Them Theory Summary & Review: Master Your Inner Peace
MohammedTouzani2
PDF
Psychology of Entrepreneurship - Bansko Nomad Fest
Kalin Karakehayov
PDF
VPM - III - VPRDM-WASF-RRS-QQ-LWSAWQAFDD
thesisvnit
PPTX
reported-speech-grammar-guides-oneonone-activities_125089.pptx
MohamedAhmed292169
PPTX
Communication_Skills_Class10_Final.pptx 19/06/2025
namanrastogi70555
PPTX
PSAP-G11-and-G12-Bag-of-Feelings-Session-1.pptx
johnrusselvelario492
PDF
Rewire Your Day: 10 Everyday Biohacks for Energy, Clarity, and Empowerment
cathassistservice
PDF
The Anxious Generation Summary: How Digital Upheaval Is Damaging Youth Mental...
MohammedTouzani2
KK KLUB
zukkunft
Personal Safety for Women - 12 Reasons Why Women Stay in An Abusive Relations...
Robert Kaiser
Extended_Colorful_Presentation_with_Icons.pptx
w6pvzbjp7m
Psychosocial support activity emotion space.pptx
AnnaMae39
The Let Them Theory Summary & Review: Master Your Inner Peace
MohammedTouzani2
Psychology of Entrepreneurship - Bansko Nomad Fest
Kalin Karakehayov
VPM - III - VPRDM-WASF-RRS-QQ-LWSAWQAFDD
thesisvnit
reported-speech-grammar-guides-oneonone-activities_125089.pptx
MohamedAhmed292169
Communication_Skills_Class10_Final.pptx 19/06/2025
namanrastogi70555
PSAP-G11-and-G12-Bag-of-Feelings-Session-1.pptx
johnrusselvelario492
Rewire Your Day: 10 Everyday Biohacks for Energy, Clarity, and Empowerment
cathassistservice
The Anxious Generation Summary: How Digital Upheaval Is Damaging Youth Mental...
MohammedTouzani2
Ad

Interpreting simple pie_charts

  • 1. Learning Intention: To interpret pie charts What does the Pie Chart tell us? A) If the class had 20 children in it how many would be boys? B) How much would each segment be worth if the class was 30 children? C) Can you say why this pie chart can not show a class of 10 children? (What would 遜 be) A) If 4 children were asked this question how many children does one segment represent? B) If 8 Children were asked this question what does each segment represent? C) If the total survey was of 20 children how many childrens favourite ice cream was strawberry? D) If the total survey was of 200 children how many childrens favourite ice cream was strawberry? E) If the total survey was of 200 children, how many children all together liked Vanilla and strawberry? F) Can you explain why this pie chart cannot show 10 childrens favourite ice cream? (think what 村 would be)
  • 2. What does the Pie Chart tell us? This pie chart shows how 20 children got to school. A)How many children walk to school? B) How many children catch the bus to school? C) How many children get a lift to school? This pie chart shows how 80 children got to school. A)How many children prefer xbox? B) How many children prefer Playstation 3? C) How many children prefer DS? Learning Intention: To interpret pie charts
  • 3. Learning Intention: To interpret pie charts What does the Pie Chart tell us? This pie chart shows 40 childrens favourite lessons. A)How many children s favourite lesson is UCT? B)How many children s favourite lesson is Games? C)How many children s favourite lesson is Literacy? D)How many more children like ICT than Literacy? E)What fraction of the children prefer Maths? This pie chart shows 120 childrens favourite sport. A)How many children s favourite sport is Football? B)How many children s favourite sport is basketball? C)If there were twice as many children in the survey how many children s favourite sport would be swimming? D)What fraction of the children liked badminton the most?
  • 4. Learning Intention: To interpret pie charts Here is a pie chart. Make up your own story to explain what the pie chart shows. Set 5 questions for your partner to answer about the chart, you must be able to answer the questions your self.