Introducing our approach to interpreting machine learning models
0 likes242 views

https://mercari.connpass.com/event/142853/ でのslideとなります.


Introducing our approach to interpreting machine learning models
- 1. 機械学習モデルの解釈性への取り組みの ご紹介 メルペイ @hmj 2019/08/27 メルカリ メルペイMachineLearning meetup! 未来を創るML最前線技術の応用と実践
- 2. 自己紹介 @Hmj_kd メルペイ Machine Learning Engineer 北海道釧路市出身. 釧路高専を卒業後に東京工業大学物理学科へ編入学し , 理論宇 宙物理学を専攻. 情報キュレーションサービス会社でのデータ分析,ロジックの開発 ?運用を経て, 2018年より株式会社メルペイにて機械学習 /自然言語処理を中心 としたメルペイあと払いの与信モデルのトランスミッションの設計開 発に携わる.
- 3. 今日はこんなことを話します 1. メルペイあと払いの問題設定について振り返り 2. いま機械学習の解釈性をやる理由 3. メルペイあと払い与信モデルでの解釈性の例の取り組みのご紹介 4. これから
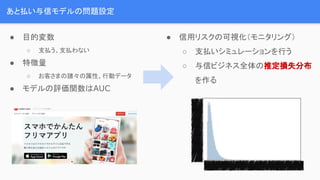
- 7. あと払い与信モデルの問題設定 ● 目的変数 ○ 支払う、支払わない ● 特徴量 ○ お客さまの諸々の属性、行動データ ● モデルの評価関数はAUC ● 信用リスクの可視化(モニタリング) ○ 支払いシミュレーションを行う ○ 与信ビジネス全体の推定損失分布 を作る
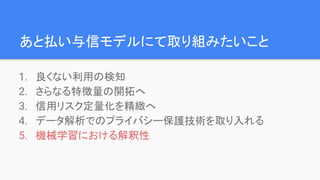
- 8. あと払い与信モデルにて取り組みたいこと 1. 良くない利用の検知 2. さらなる特徴量の開拓へ 3. 信用リスク定量化を精緻へ 4. データ解析でのプライバシー保護技術を取り入れる 5. 機械学習における解釈性
- 9. 機械学習における解釈性 Interpretability in Machine Learning
- 10. 機械学習の解釈性への注目が高まっている背景 ● 社会的背景 ○ EUのGeneral Data Protection Regulation (GDPR)や, ○ 日本の総務省のに「AI開発ガイドライン案」 など, ○ 社会的な背景から解釈性や説明性などへの注目が高まってきている ● GAFA(Google、Amazon.com、Facebook、Apple Inc.)の動き ○ Open sourcing a library to enable intelligibility in machine learning など ■ https://github.com/Microsoft/interpret ○ 自身たちでもDeep系モデルの理解と活用のために ○ 研究開発などが盛ん
- 11. 私たちが解釈性に取り組むモチベーション 1. 主にチームが自分たち自身で理解するため a. モデルのdebug, エラー分析 b. 理解することで次なる改善のアクションを検討できるため 2. 機械学習の解釈性の研究領域に取り組む理由をもっている 3. 人間と機械の協力 a. モデルによる決定をどのように説明し信頼してもらうか 4. 社会的にも注目されている
- 12. では, 実務的な面ではどうか ? 以下のような説明を求められる可能性がある 1. どの特徴量が重要か ? a. 「与信モデルが何に重みをおいているか」 2. 各特徴量が予測にどう影響しているか ? a. 「一般的に何をすれば与信枠が上がりますか?」 3. ある予測結果について各特徴量がどう寄与するか a. 「与信枠がこのくらいなのは原因は何ですか?」
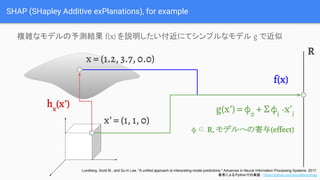
- 14. SHAP (SHapley Additive exPlanations), for example 複雑なモデルの予測結果 f(x) を説明したい付近にてシンプルなモデル g で近似 x = (1.2, 3.7, 0.0) x’ = (1, 1, 0) f(x) hx (x’) g(x’) = φ0 + Σφi ?x’i φ ∈ R, モデルへの寄与(effect) Lundberg, Scott M., and Su-In Lee. "A unified approach to interpreting model predictions." Advances in Neural Information Processing Systems. 2017. 著者によるPythonでの実装 : https://github.com/slundberg/shap R
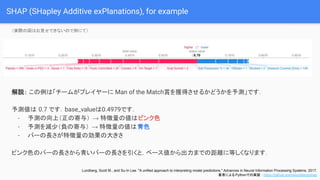
- 15. SHAP (SHapley Additive exPlanations), for example 解説: この例は「チームがプレイヤーに Man of the Match賞を獲得させるかどうかを予測」です. 予測値は 0.7 です.base_valueは0.4979です. - 予測の向上(正の寄与) → 特徴量の値はピンク色 - 予測を減少(負の寄与) → 特徴量の値は青色 - バーの長さが特徴量の効果の大きさ ピンク色のバーの長さから青いバーの長さを引くと,ベース値から出力までの距離に等しくなります. (実際の図はお見せできないので例にて) Lundberg, Scott M., and Su-In Lee. "A unified approach to interpreting model predictions." Advances in Neural Information Processing Systems. 2017. 著者によるPythonでの実装 : https://github.com/slundberg/shap
- 16. 解釈性?説明性に関する 実際のビジネスでのすり合わせについて ● わたしたちは溢れ出る説明責任を果たしたい,という立ち位置. ● 特に正解があるわけではないので様々なステークホルダーとコミュニケーション (試行錯誤)しながら進めている ○ SHAPなども手放しに使用できるわけではなく,実装者による説明は常に残る. ● 機械学習モデルの解釈性の研究や道具立ては進んできている ○ 一方でこれが実際の場面で “有用そう/有用ではなさそう” があまり知見がない ○ 実務面から研究分野へうまくフィードバックなりメルペイとして研究もしていきたい
- 17. ご清聴ありがとうございます !!