


More Related Content
What's hot (20)
Similar to Lab16 (20)


More from BPurev (20)


Lab16
- 1. 1 Лабораторын ажил №16 ТӨСЛИЙН УДИРДЛАГА: Гантт график байгуулах ЗОРИЛГО: Төсөл бичиж сурах даалгаварын хүрээнд Төсөлд хэрэгжүүлэх ажлуудыг хугацаагаар хуваарилах, ерөнхий төлөвлөгөө гаргахад суралцана. Ажлын ерөнхий зураглал хийж сурсаны дараа ямар хугацаанд уг ажлыг гүйцэтгэхээр төлөвлөж байгааг дүрслэх, ажлын төлөвлөгөөг хугацааны хамт төлөвлөхөд уг лабораторын ажлын зорилго оршино. ЧАДВАР: Excel програм ашиглан хялбар төлөвлөгөө зохиох чадвартай болно. Гантт график гэж юу вэ? Гантийн график нь 1910-аад оны эхээр энэ бүдүүвчийг зохион бүтээсэн механик инженер, менежментийн зөвлөх Америк гаралтай Henry Gantt нэрээр нэрлэгджээ. Гантт диаграм нь төслийн даалгавруудыг дараалсан хэвтээ зураасан блок хэлбэрээр дүрсэлдэг. Гантт график нь төслийн шаталсан бүтцийн эхлэх, дуусах хугацааг харуулах ба төслийн үйл ажиллагааны хоорондын хамаарлыг харуулдаг бөгөөд ингэснээр та тэдгээрийг хуваарьт хугацаандаа эсвэл урьдчилан тодорхойлсон чухал үйл явдлуудтай харьцуулан дүгнэх боломжийг олгодог. 1. Төслийн хүснэгтийг үүсгэх Төслийн өгөгдлийг Excel хүснэгтэд оруулна. Даалгавар тус бүрийн жагсаалтыг мөр бүрт тус тусад нь жагсааж, төслийн төлөвлөгөөгөөн дахь Эхлэх огноо, Дуусах огноо, Хугацаа, үүнд даалгаврыг гүйцэтгэхэд шаардагдах өдрийн тоо зэргийг оруулна.
- 2. 2 2. Эхлэх огноо дээр суурилсан стандарт Excel Bar графикийг үүсгэнэ. Stacked Bar төрлийн графикийг сонгож Gantt графикийг Excel дээр үүсгэнэ. • Өгсөн хүснэгтийн Эхлэх огноо буюу B1: B11 баганын утгуудыг сонгоно. Багана бүхэлдээ биш зөвхөн өгөгдөл бүхий нүднүүдийг сонгосон эсэхийг шалгаарай. • Insert командын зурвасын Chart бүлгийн Bar дээр дар. • 2-D Bar хэсгийн Stacked Bar дээр дарна. Нүдийг зөв сонгож авсан бол дэлгэцэнд дараахь график бэлэн болно. 3. Алхам 3. Үргэлжлэх хугацааг хүснэгтэнд нэмнэ Gantt график дээр хүснэгтийн өгөгдлийг нэмж оруулья.
- 3. 3 1. График дээр хулганы баруун товчийг дарж нээгдэх цэснээс Select Data… командыг сонгоно. Select Data Source цонх нээгдэх Start Date багана Legend Entries (Series) хэсэгт харагдаж байна. Үргэлжлэх хугацааг графикт нэмж оруулья. 2. Гантын график дээр байршуулахыг хүсч байгаа баганын өгөгдлийг (Хугацаа) сонгохын тулд Add товчийг дарна. 3. Edit Series цонх нээгдэж дараах үйлдлийг гүйцэтгэнэ: • Series name талбарт "Үргэлжлэх хугацаа" гэж оруулна. Өөрөөр хэлбэл хулганы заагчийг энэ талбарт байрлуулж, хүснэгтийн баганын нэрийг сонгоход Гантын хүснэгтэд дүрслэх утга Series name хэсэгт нэмэгдэнэ. • Муж сонгох товчлуурыг сонгож Series Values талбарт дараагийн утгыг сонгоно. 4. Edit Series цонх нээгдэнэ. Төслийн хугацааны өгөгдлийг сонгоод эхний нүдний өгөгдлийг сонгож (бидний хувьд D2) сонгоод хулганы заагчийг сүүлчийн нүд (D11) хүртэл нь чирнэ. Баганы толгой болон хоосон нүд оруулж сонгохгүй.
- 4. 4 5. Цонхыг хураах товчлуурыг сонгож жижиг цонхыг хаана. Өмнөх Edit Series цонх руу шилжих бөгөөд энд Series name, Series values нүднүүдэд тохирох утгууд сонгогдсон тул ОК товчлуур дарна. 6. Select Data Source цонх руу шилжсэн бөгөөд огноо Date ба хугацаа Duration талбарууд Legend Entries (Цуврал) хэсэгт нэмэгдсэн байна. Үндсэн график руу дүрслэхийг хүссэн баганы өгөгдлийг нэмсэн бол ОК товчлуур дарж цонхыг хаана.
- 5. 5 Үр дүнд дараахь график бэлэн болно. 4. Алхам 4. Гант графикт ажил үүргийн тодорхойлолт нэмэх Одоо графикийн зүүн талд байгаа өдрүүдийг хийх ажлын жагсаалтаар солих хэрэгтэй. 1. График байрлаж буй мужийн аль нэг хэсэгт (цэнхэр, улбар шар өнгийн талбар) хулганы баруун товчийг дарж Select Data командыг сонгон Select Data Source цонхыг нээнэ. 2. зүүн талын самбар Эхлэх огноо сонгосон эсэхийг шалгаад Horizontal (Category) Axis Labels хэсэгт Edit товчлуурыг сонгож дарна. 3. Axis Label жижиг цонх нээгдэж төслийн хүрээнд гүйцэтгэх ажлыг сонгохдоо Durations буюу хугацааг байгуулах өмнөх алхамын аргыг ашиглана. товчлуурыг дарж хүснэгтэд бичигдсэн эхний ажлаас сүүлийнх хүртэл хулганы товчлуурыг дарж чирнэ. Хүснэгтийн баганын нэрийг оруулахгүйгээр сонгосон эсэхийг шалгаарай. Нүднийг өгөгдлийг сонгосны дараа цонхыг нээх товчлуурыг дахин дарж командын цонхыг хаана.
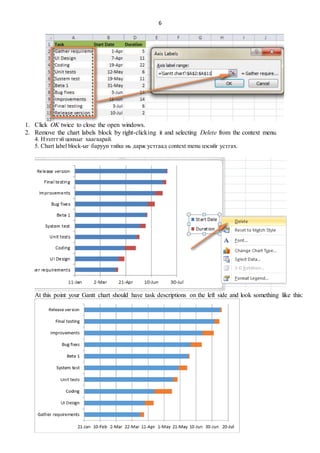
- 6. 6 1. Click OK twice to close the open windows. 2. Remove the chart labels block by right-clicking it and selecting Delete from the context menu. 4. –ù—ç—ç–ª—Ç—Ç—ç–π —Ü–æ–Ω—Ö—ã–≥ —Ö–∞–∞–≥–∞–∞—Ä–∞–π. 5. Chart label block-—ã–≥ –±–∞—Ä—É—É–Ω —Ç–∏–π—à –Ω—å –¥–∞—Ä–∂ —É—Å—Ç–≥–∞–∞–¥ context menu —Ü—ç—Å–∏–π–≥ —É—Å—Ç–≥–∞—Ö. At this point your Gantt chart should have task descriptions on the left side and look something like this:
- 7. 7 5. Алхам 5. Баганан диаграмыг Excel Gantt графикт хувиргах Графикт хөх өнгөөр дүрсэлсэн багануудыг хасаж улбар шар өнгийн баганыг үлдээвэл бидний хүсэж буй гантт график үүснэ. 1. Графикийн цэнхэр багана дээр хулганы заагчийг байрлуулан баруун товчлуурыг дарж Format Data Series командыг сонгоно. 2. Format Data Series цонхнод дараах үйлдлийг гүйцэтгэнэ: o Fill командын No Fill сонгоно. o Border Color командын No Line сонгоно.
- 8. 8 3. Excel Gantt хүснэгтийн даалгаврууд урвуу дарааллаар байрлуулсан бөгөөд хугацааны хувьд ойлгомжтой байдлаар дүрсэлж үзүүлье. Gantt графикийн зүүн гар талын даалгаврын жагсаалтыг дарж сонгоно. Format Axis цонх нээгдэнэ. Categories in reverse order option нүдийг сонгоод цонхыг хаана.
- 9. 9 6. Алхам 6. Gantt схемийн загварыг сайжруулах 1. Гантт графикийн зүүн гар талын хоосон зайг устга. Төслийн эхлэлд төлөвлөж байгаа хугацааг цэнхэр баганаар дүрсэлсэн байна. Одоо босоо тэнхлэгт төслийн гүйцэтгэх ажлыг байрлуулахын тулд хоосон зайг устгая. • Хүснэгтийн эхний эхлэх огноо дээр хулганы баруун товчийг дарж Format Cells → General команд сонгоно. Эхлэх огноог оруулна. Жишээн дээр 41730. Excel программд 1900 оны 1 сарын 1 ээс хойшхи өдрүүдийг тоон утгаар илэрхийлнэ. Иймд тоон утгыг өөрчлөлгүй (Cancel) хэвээр үлдээнэ.
- 10. 10 • Гантт график дээрх аль нэг огноог сонгоно. Нэг удаа сонгох үйлдлээр бүх огноо идэвхижих бөгөөд хулганы баруун товч дарж Format Axis командыг сонгоно. 1. Гантын график дээрх огнооны тоог тохируулна. Өмнөх алхамд ашигласан Format Axis цонхонд Major unit болон Minor unit утгуудыг Fixed нүдэнд солиод огноог үзүүлэх интервалын тоог оруулна. Энд ашиглах утга бага байвал төслийн хугацааны завсар богино байна. Жишээ нь хэрэв бусад өдөр тутмын үйл ажиллагааг үзүүлэхийг хүсч байгаа бол Major unit нүдэнд 2-ыг оруулна. 2. Графикт дүрслэж буй баганууд хоорондоо зайгүй байхаар тохируулья. • Баганын аль нэг хэсэгт хулганы заагчаар сонгож баруун товчийг дараад Format Data Series командыг сонгоно. (Бүх багануудыг сонгосон эсэхийг шалгаарай)
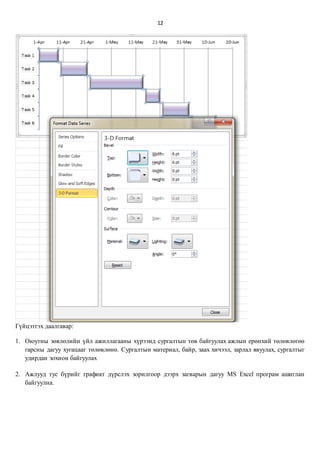
- 11. 11 o Format Data Series харилцах цонхонд Separeted хэсэгт 100% -ийг, Gap Width хэсэгт өргөнийг 0% (0% -р ойртсон) болгон өөрчилнө. Дээрх алхамуудыг гүйцэтгэж дуусахад Гант график дараахь байдалтай харагдана. • Гант графикийн өнгө, хүрээний өнгө, сүүдрийг өөрчилж 3-D форматаар дүрсэлж болно. Эдгээр сонголтууд нь Format Data Series цонхонд байрлана.
- 12. 12 Гүйцэтгэх даалгавар: 1. Оюутны зөвлөлийн үйл ажиллагааны хүрээнд сургалтын төв байгуулах ажлын ерөнхий төлөвлөгөө гарсны дагуу хугацааг төлөвлөнө. Сургалтын материал, байр, заах хичээл, зарлал явуулах, сургалтыг удирдан зохион байгуулах 2. Ажлууд тус бүрийг графикт дүрслэх зорилгоор дээрх загварын дагуу MS Excel програм ашиглан байгуулна.