NORMAL CURVE DISTRIBUTION OR BALANCE CURVE
Download as pptx, pdf0 likes23 views
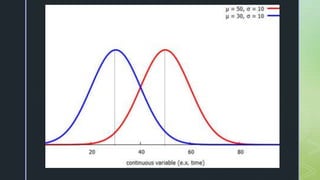
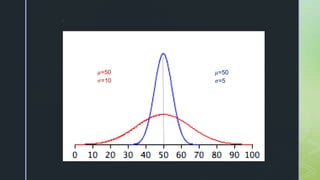
Here are the answers to the quiz questions: I. 1. Area = 0.4165 - 0.0253 = 0.3912 2. Area = 0.9646 3. Area = 0.3275 II. [Sketches the two normal curves described] The first curve is centered at 15 with width determined by Žā of 4. The second curve is centered at 25 with the same width determined by Žā of 4. III. One real-life situation where a normal distribution can be used is to model human height in a population. Since most people's heights cluster around an average with decreasing frequencies further from the average in both directions, height follows an approximate
1 of 44
Download to read offline


Ad
Recommended
statistics...normal/ distribution curvee
statistics...normal/ distribution curveeWORLDMUSICDEFINER
╠²
The document explains normal distribution, also known as Gaussian distribution, highlighting its key properties and the empirical rule stating that approximately 68%, 95%, and 99.7% of data fall within one, two, and three standard deviations from the mean, respectively. It includes examples related to height and wages, as well as explanations on calculating frequencies and percentages within these standard deviations. Furthermore, it introduces the concept of z-scores in the standard normal distribution and includes a quiz section for practical application of the concepts discussed.Presentation1.pptx .normal curve/distribution
Presentation1.pptx .normal curve/distributionWORLDMUSICDEFINER
╠²
The document discusses normal distribution, including its properties and applications in statistics. It explains the empirical rule and provides examples involving the calculation of frequencies and areas under the normal curve using standard deviation and z-scores. Additionally, it includes exercises and quizzes to practice understanding and applying normal distribution concepts.Presentation1.ppt.education and learning
Presentation1.ppt.education and learningWORLDMUSICDEFINER
╠²
The document discusses the concept of normal distribution, defining it as a fundamental statistical curve characterized by its bell shape, symmetry, and properties related to mean and standard deviation. It explains the empirical rule, detailing the percentages of data that fall within one, two, and three standard deviations from the mean. Various examples, formulas for calculating frequencies, and exercises to apply these concepts are also included.Statistics and Probability- NORMAL DISTRIBUTION.pptx
Statistics and Probability- NORMAL DISTRIBUTION.pptxAshellyTugdang
╠²
The document provides an in-depth explanation of the normal distribution, its properties, and calculations involving standard deviations and probabilities. Key concepts include the relationship between the mean and standard deviation, the empirical rule, and examples demonstrating the calculation of probabilities and percentiles. It also covers the historical background of the normal curve and the use of z-scores in statistics.Distribution................................pptx
Distribution................................pptxannarosegarcia1
╠²
.........................................Inferiential statistics .pptx
Inferiential statistics .pptxMelba Shaya Sweety
╠²
1. The document discusses the normal distribution and z-distribution (standard normal distribution). It provides definitions, properties, and examples of both.
2. The normal distribution is a bell-shaped curve that is symmetric around the mean. It is defined by its mean and standard deviation. The z-distribution is the standard normal distribution where the mean is 0 and standard deviation is 1.
3. Examples are provided to demonstrate how to calculate probabilities and find z-scores using the normal and z-distributions. Areas under the curve are calculated to find probabilities for various values in relation to the mean.Nossi ch 11
Nossi ch 11lesaturner
╠²
The document summarizes key concepts about normal distributions and using z-scores. It includes examples of calculating percentages of data that fall within a certain number of standard deviations from the mean. It also discusses how to convert between standard and population normal distributions using z-scores. An example problem at the end solves for the percentage of marathon finishers with times between 285-335 minutes.4 2 continuous probability distributionn
4 2 continuous probability distributionnLama K Banna
╠²
Here are the steps to solve this problem:
a) Find the z-score corresponding to 115 mm Hg: (115 - 85)/13 = 2.31
The proportion that is NOT severely hypertensive is 1 - P(Z >= 2.31) = 1 - 0.0103 = 0.9897
b) Find the z-score corresponding to 90 mm Hg: (90 - 85)/13 = 0.3846
The proportion that will be asked to consult a physician is P(Z >= 0.3846) = 0.6507
c) Find the z-scores corresponding to the mildly hypertensive range:
(90 - 85)/13 = 0.3846
(-Normal-Distribution-ppt.ppt-POWER PRESENTATION ON STATISTICS AND PROBABILITY
-Normal-Distribution-ppt.ppt-POWER PRESENTATION ON STATISTICS AND PROBABILITYRODULFOVPAQUINGAN
╠²
The document provides a comprehensive overview of normal probability distributions, detailing their properties, the significance of the mean and standard deviation, and how to interpret normal curves. It also explains the transformation of data into z-scores and the calculation of areas under the standard normal curve for probability assessments. Examples throughout illustrate how to apply these concepts to determine probabilities in real-world scenarios.The-Normal-Distribution, Statics and Pro
The-Normal-Distribution, Statics and ProGiancarloMercado2
╠²
The document discusses the normal distribution, also known as the gaussian distribution, which is a continuous probability distribution characterized by its bell-shaped curve defined by the mean (╬╝) and standard deviation (Žā). It outlines the properties of the normal distribution, including its symmetry, unimodality, and the significance of areas under the curve for probability calculations. Additionally, it explains how to derive standard scores (z-scores) and compute probabilities based on given means and standard deviations in various examples.REPORT MATH.pdf
REPORT MATH.pdfJelo Sunido
╠²
This document discusses frequency distributions, histograms, and the normal distribution. It provides examples of grouped and relative frequency distributions and how to construct histograms to visualize this data. It also explains key properties of the normal distribution including the empirical rule and how it relates to standard deviations from the mean. Finally, it covers how to calculate z-scores to standardize values and use z-tables to find probabilities for the standard normal distribution.The normal distribution and its properties.pptx
The normal distribution and its properties.pptxRodelLaman1
╠²
This document discusses the normal distribution and its key properties. It explains that a normal distribution is a continuous, bell-shaped curve that is symmetrical about the mean. It also describes some important characteristics of the normal curve, such as being asymptotic to the x-axis, having its highest point at the mean, and satisfying the 68-95-99.7% rule regarding how much of the distribution falls within a given number of standard deviations of the mean. The document then introduces the standard normal distribution and the z-score, explaining how to look up areas under the normal curve using the z-table.Stat Module 3 Normal Distribution ppt.pptx
Stat Module 3 Normal Distribution ppt.pptxMaricarDimas2
╠²
This document provides an overview of the normal distribution and its key properties. It discusses how to:
1. Illustrate a normal distribution curve and identify its mean, standard deviation, and symmetrical, bell-shaped properties.
2. Use the empirical rule to determine what percentage of the distribution falls within 1, 2, or 3 standard deviations of the mean.
3. Convert between a normal random variable and a standard normal variable, and compute probabilities and percentiles using the standard normal distribution table.Lect. 04 Normal distribution biostatistics
Lect. 04 Normal distribution biostatisticsAsifaBhutto1
╠²
This document discusses the normal distribution, defining it as a critical statistical distribution characterized by its symmetrical, bell-shaped curve. It outlines properties such as the total area under the curve being equal to 1 and describes how observations cluster around the mean, with specific percentages falling within one, two, and three standard deviations. Additionally, it explains transformations to standard normal distribution using z-scores and identifies outliers as measurements with z-scores beyond ┬▒3.Normal Probability Distribution
Normal Probability Distributionmandalina landy
╠²
The document discusses properties of normal distributions and the standard normal distribution. It provides examples of finding probabilities and values associated with normal distributions. The key points are:
- Normal distributions are continuous and bell-shaped. The mean, median and mode are equal.
- The standard normal distribution has a mean of 0 and standard deviation of 1.
- Probabilities under the normal curve can be found using z-scores and the standard normal table.
- Values like z-scores can be determined by finding the corresponding cumulative area in the standard normal table.normal curve distribution biostatics course.pptx
normal curve distribution biostatics course.pptxarafatibraim
╠²
The document provides an introduction to the normal distribution and its properties, highlighting its importance in determining normal intervals for various medical tests and other traits. It explains concepts like standard scores (z scores), the empirical rule, and methods for interpreting normal curves. Additionally, it discusses practical applications and how to calculate probabilities using the standard normal distribution.Normal curve
Normal curveAriston Balogbog
╠²
The normal curve, also called the bell curve, is an important probability distribution that is symmetric and asymptotic. It originated in the 18th century with the work of de Moivre and Laplace. The normal distribution is significant because psychological and educational variables often follow it approximately and it is easy for statisticians to work with mathematically. Key characteristics include being symmetric, ranging from negative to positive infinity, and following the 68-95-99.7 rule where most values fall within 1-3 standard deviations of the mean. The mean, median and mode are equal for a normal distribution.Ch3 Probability and The Normal Distribution
Ch3 Probability and The Normal Distribution Farhan Alfin
╠²
This document provides an introduction to probability and the normal distribution. It defines probability as the chance of an event occurring, and discusses empirical probability determined by observation. It introduces the normal distribution and its key properties including that it is symmetric and bell-shaped. The document also discusses calculating probabilities and areas under the standard normal curve, including between and outside given z-values.04.NORMAL DISTRIBUTION stat and probab.pptx
04.NORMAL DISTRIBUTION stat and probab.pptxninosulit
╠²
This document provides an overview of using the z-distribution table to find probabilities associated with standard scores. It begins by explaining how to locate standard scores (z-values) on the z-table and find the corresponding area or probability to the left of that score. Several examples are given of looking up z-values and calculating probabilities. The document then discusses the key properties of the normal distribution curve and how it can be used to determine probabilities in specific regions based on where z-values fall under the curve.Chapter 7 Powerpoint
Chapter 7 PowerpointZIADALRIFAI
╠²
The document outlines the goals and key concepts of a chapter on continuous probability distributions. It discusses the differences between discrete and continuous distributions. It then focuses on the uniform, normal, and binomial distributions, explaining how to calculate probabilities and values for each. Key points covered include the mean, standard deviation, and shape of each distribution as well as how to find z-values and probabilities using the normal distribution and binomial approximation.statistics and probabililtyyyyyyyyyyyyyyyyyyyyyyyyyyyyyyyyyyyyyyyyyyyyyyyyyyy...
statistics and probabililtyyyyyyyyyyyyyyyyyyyyyyyyyyyyyyyyyyyyyyyyyyyyyyyyyyy...mirabuenocharizze9
╠²
bell curveChapter 2 understanding the normal curve distribution
Chapter 2 understanding the normal curve distributionAntonio F. Balatar Jr.
╠²
This document discusses the normal distribution and standard normal curve. It defines key properties of the normal distribution including that it is bell-shaped and symmetrical around the mean. The standard normal curve is introduced which has a mean of 0 and standard deviation of 1. The z-score is defined as a way to locate a value within a distribution based on its mean and standard deviation. Various probabilities are associated with areas under the normal curve based on z-scores.Statistics
Statistics maamir farooq
╠²
The document discusses the normal probability distribution, also called the Gaussian distribution. It describes key properties of the normal distribution including that it is symmetrical and bell-shaped around the mean. The normal distribution is defined by its mean and standard deviation. The standard normal distribution refers to a normal distribution with a mean of 0 and standard deviation of 1. The document provides examples of how to calculate z-scores and find probabilities associated with the normal distribution.The standard normal curve & its application in biomedical sciences
The standard normal curve & its application in biomedical sciencesAbhi Manu
╠²
1) The document discusses the normal distribution and its applications in statistical inference. It is the most important probability distribution used to model many continuous variables in biomedical fields.
2) The normal distribution is characterized by its mean and standard deviation. It is perfectly symmetrical and bell-shaped. Properties of the normal curve include that about 68%, 95%, and 99.7% of the data lies within 1, 2, and 3 standard deviations of the mean, respectively.
3) The standard normal distribution is used to convert raw scores to z-scores in order to compare variables measured on different scales. Z-scores indicate how many standard deviations a score is above or below the mean and can be used to determine probabilities, percentilesPEST OF WHEAT SORGHUM BAJRA and MINOR MILLETS.pptx
PEST OF WHEAT SORGHUM BAJRA and MINOR MILLETS.pptxArshad Shaikh
╠²
Wheat, sorghum, and bajra (pearl millet) are susceptible to various pests that can significantly impact crop yields. Common pests include aphids, stem borers, shoot flies, and armyworms. Aphids feed on plant sap, weakening the plants, while stem borers and shoot flies damage the stems and shoots, leading to dead hearts and reduced growth. Armyworms, on the other hand, are voracious feeders that can cause extensive defoliation and grain damage. Effective management strategies, including resistant varieties, cultural practices, and targeted pesticide applications, are essential to mitigate pest damage and ensure healthy crop production.More Related Content
Similar to NORMAL CURVE DISTRIBUTION OR BALANCE CURVE (20)
4 2 continuous probability distributionn
4 2 continuous probability distributionnLama K Banna
╠²
Here are the steps to solve this problem:
a) Find the z-score corresponding to 115 mm Hg: (115 - 85)/13 = 2.31
The proportion that is NOT severely hypertensive is 1 - P(Z >= 2.31) = 1 - 0.0103 = 0.9897
b) Find the z-score corresponding to 90 mm Hg: (90 - 85)/13 = 0.3846
The proportion that will be asked to consult a physician is P(Z >= 0.3846) = 0.6507
c) Find the z-scores corresponding to the mildly hypertensive range:
(90 - 85)/13 = 0.3846
(-Normal-Distribution-ppt.ppt-POWER PRESENTATION ON STATISTICS AND PROBABILITY
-Normal-Distribution-ppt.ppt-POWER PRESENTATION ON STATISTICS AND PROBABILITYRODULFOVPAQUINGAN
╠²
The document provides a comprehensive overview of normal probability distributions, detailing their properties, the significance of the mean and standard deviation, and how to interpret normal curves. It also explains the transformation of data into z-scores and the calculation of areas under the standard normal curve for probability assessments. Examples throughout illustrate how to apply these concepts to determine probabilities in real-world scenarios.The-Normal-Distribution, Statics and Pro
The-Normal-Distribution, Statics and ProGiancarloMercado2
╠²
The document discusses the normal distribution, also known as the gaussian distribution, which is a continuous probability distribution characterized by its bell-shaped curve defined by the mean (╬╝) and standard deviation (Žā). It outlines the properties of the normal distribution, including its symmetry, unimodality, and the significance of areas under the curve for probability calculations. Additionally, it explains how to derive standard scores (z-scores) and compute probabilities based on given means and standard deviations in various examples.REPORT MATH.pdf
REPORT MATH.pdfJelo Sunido
╠²
This document discusses frequency distributions, histograms, and the normal distribution. It provides examples of grouped and relative frequency distributions and how to construct histograms to visualize this data. It also explains key properties of the normal distribution including the empirical rule and how it relates to standard deviations from the mean. Finally, it covers how to calculate z-scores to standardize values and use z-tables to find probabilities for the standard normal distribution.The normal distribution and its properties.pptx
The normal distribution and its properties.pptxRodelLaman1
╠²
This document discusses the normal distribution and its key properties. It explains that a normal distribution is a continuous, bell-shaped curve that is symmetrical about the mean. It also describes some important characteristics of the normal curve, such as being asymptotic to the x-axis, having its highest point at the mean, and satisfying the 68-95-99.7% rule regarding how much of the distribution falls within a given number of standard deviations of the mean. The document then introduces the standard normal distribution and the z-score, explaining how to look up areas under the normal curve using the z-table.Stat Module 3 Normal Distribution ppt.pptx
Stat Module 3 Normal Distribution ppt.pptxMaricarDimas2
╠²
This document provides an overview of the normal distribution and its key properties. It discusses how to:
1. Illustrate a normal distribution curve and identify its mean, standard deviation, and symmetrical, bell-shaped properties.
2. Use the empirical rule to determine what percentage of the distribution falls within 1, 2, or 3 standard deviations of the mean.
3. Convert between a normal random variable and a standard normal variable, and compute probabilities and percentiles using the standard normal distribution table.Lect. 04 Normal distribution biostatistics
Lect. 04 Normal distribution biostatisticsAsifaBhutto1
╠²
This document discusses the normal distribution, defining it as a critical statistical distribution characterized by its symmetrical, bell-shaped curve. It outlines properties such as the total area under the curve being equal to 1 and describes how observations cluster around the mean, with specific percentages falling within one, two, and three standard deviations. Additionally, it explains transformations to standard normal distribution using z-scores and identifies outliers as measurements with z-scores beyond ┬▒3.Normal Probability Distribution
Normal Probability Distributionmandalina landy
╠²
The document discusses properties of normal distributions and the standard normal distribution. It provides examples of finding probabilities and values associated with normal distributions. The key points are:
- Normal distributions are continuous and bell-shaped. The mean, median and mode are equal.
- The standard normal distribution has a mean of 0 and standard deviation of 1.
- Probabilities under the normal curve can be found using z-scores and the standard normal table.
- Values like z-scores can be determined by finding the corresponding cumulative area in the standard normal table.normal curve distribution biostatics course.pptx
normal curve distribution biostatics course.pptxarafatibraim
╠²
The document provides an introduction to the normal distribution and its properties, highlighting its importance in determining normal intervals for various medical tests and other traits. It explains concepts like standard scores (z scores), the empirical rule, and methods for interpreting normal curves. Additionally, it discusses practical applications and how to calculate probabilities using the standard normal distribution.Normal curve
Normal curveAriston Balogbog
╠²
The normal curve, also called the bell curve, is an important probability distribution that is symmetric and asymptotic. It originated in the 18th century with the work of de Moivre and Laplace. The normal distribution is significant because psychological and educational variables often follow it approximately and it is easy for statisticians to work with mathematically. Key characteristics include being symmetric, ranging from negative to positive infinity, and following the 68-95-99.7 rule where most values fall within 1-3 standard deviations of the mean. The mean, median and mode are equal for a normal distribution.Ch3 Probability and The Normal Distribution
Ch3 Probability and The Normal Distribution Farhan Alfin
╠²
This document provides an introduction to probability and the normal distribution. It defines probability as the chance of an event occurring, and discusses empirical probability determined by observation. It introduces the normal distribution and its key properties including that it is symmetric and bell-shaped. The document also discusses calculating probabilities and areas under the standard normal curve, including between and outside given z-values.04.NORMAL DISTRIBUTION stat and probab.pptx
04.NORMAL DISTRIBUTION stat and probab.pptxninosulit
╠²
This document provides an overview of using the z-distribution table to find probabilities associated with standard scores. It begins by explaining how to locate standard scores (z-values) on the z-table and find the corresponding area or probability to the left of that score. Several examples are given of looking up z-values and calculating probabilities. The document then discusses the key properties of the normal distribution curve and how it can be used to determine probabilities in specific regions based on where z-values fall under the curve.Chapter 7 Powerpoint
Chapter 7 PowerpointZIADALRIFAI
╠²
The document outlines the goals and key concepts of a chapter on continuous probability distributions. It discusses the differences between discrete and continuous distributions. It then focuses on the uniform, normal, and binomial distributions, explaining how to calculate probabilities and values for each. Key points covered include the mean, standard deviation, and shape of each distribution as well as how to find z-values and probabilities using the normal distribution and binomial approximation.statistics and probabililtyyyyyyyyyyyyyyyyyyyyyyyyyyyyyyyyyyyyyyyyyyyyyyyyyyy...
statistics and probabililtyyyyyyyyyyyyyyyyyyyyyyyyyyyyyyyyyyyyyyyyyyyyyyyyyyy...mirabuenocharizze9
╠²
bell curveChapter 2 understanding the normal curve distribution
Chapter 2 understanding the normal curve distributionAntonio F. Balatar Jr.
╠²
This document discusses the normal distribution and standard normal curve. It defines key properties of the normal distribution including that it is bell-shaped and symmetrical around the mean. The standard normal curve is introduced which has a mean of 0 and standard deviation of 1. The z-score is defined as a way to locate a value within a distribution based on its mean and standard deviation. Various probabilities are associated with areas under the normal curve based on z-scores.Statistics
Statistics maamir farooq
╠²
The document discusses the normal probability distribution, also called the Gaussian distribution. It describes key properties of the normal distribution including that it is symmetrical and bell-shaped around the mean. The normal distribution is defined by its mean and standard deviation. The standard normal distribution refers to a normal distribution with a mean of 0 and standard deviation of 1. The document provides examples of how to calculate z-scores and find probabilities associated with the normal distribution.The standard normal curve & its application in biomedical sciences
The standard normal curve & its application in biomedical sciencesAbhi Manu
╠²
1) The document discusses the normal distribution and its applications in statistical inference. It is the most important probability distribution used to model many continuous variables in biomedical fields.
2) The normal distribution is characterized by its mean and standard deviation. It is perfectly symmetrical and bell-shaped. Properties of the normal curve include that about 68%, 95%, and 99.7% of the data lies within 1, 2, and 3 standard deviations of the mean, respectively.
3) The standard normal distribution is used to convert raw scores to z-scores in order to compare variables measured on different scales. Z-scores indicate how many standard deviations a score is above or below the mean and can be used to determine probabilities, percentilesstatistics and probabililtyyyyyyyyyyyyyyyyyyyyyyyyyyyyyyyyyyyyyyyyyyyyyyyyyyy...
statistics and probabililtyyyyyyyyyyyyyyyyyyyyyyyyyyyyyyyyyyyyyyyyyyyyyyyyyyy...mirabuenocharizze9
╠²
Recently uploaded (20)
PEST OF WHEAT SORGHUM BAJRA and MINOR MILLETS.pptx
PEST OF WHEAT SORGHUM BAJRA and MINOR MILLETS.pptxArshad Shaikh
╠²
Wheat, sorghum, and bajra (pearl millet) are susceptible to various pests that can significantly impact crop yields. Common pests include aphids, stem borers, shoot flies, and armyworms. Aphids feed on plant sap, weakening the plants, while stem borers and shoot flies damage the stems and shoots, leading to dead hearts and reduced growth. Armyworms, on the other hand, are voracious feeders that can cause extensive defoliation and grain damage. Effective management strategies, including resistant varieties, cultural practices, and targeted pesticide applications, are essential to mitigate pest damage and ensure healthy crop production.Assisting Individuals and Families to Promote and Maintain Health ŌĆō Unit 7 | ...
Assisting Individuals and Families to Promote and Maintain Health ŌĆō Unit 7 | ...RAKESH SAJJAN
╠²
This PowerPoint presentation is based on Unit 7 ŌĆō Assisting Individuals and Families to Promote and Maintain Their Health, a core topic in Community Health Nursing ŌĆō I for 5th Semester B.Sc Nursing students, as per the Indian Nursing Council (INC) guidelines.
The unit emphasizes the nurseŌĆÖs role in family-centered care, early detection of health problems, health promotion, and appropriate referrals, especially in the context of home visits and community outreach. It also strengthens the studentŌĆÖs understanding of nursing responsibilities in real-life community settings.
¤ōś Key Topics Covered in the Presentation:
Introduction to family health care: needs, principles, and objectives
Assessment of health needs of individuals, families, and groups
Observation and documentation during home visits and field assessments
Identifying risk factors: environmental, behavioral, genetic, and social
Conducting growth and development monitoring in infants and children
Recording and observing:
Milestones of development
Menstrual health and reproductive cycle
Temperature, blood pressure, and vital signs
General physical appearance and personal hygiene
Social assessment: understanding family dynamics, occupation, income, living conditions
Health education and counseling for individuals and families
Guidelines for early detection and referral of communicable and non-communicable diseases
Maintenance of family health records and individual health cards
Assisting families with:
Maternal and child care
Elderly and chronic disease management
Hygiene and nutrition guidance
Utilization of community resources ŌĆō referral linkages, support services, and local health programs
Role of nurse in coordinating care, advocating for vulnerable individuals, and empowering families
Promoting self-care and family participation in disease prevention and health maintenance
This presentation is highly useful for:
Nursing students preparing for internal exams, university theory papers, or community postings
Health educators conducting family teaching sessions
Students conducting fieldwork and project work during community postings
Public health nurses and outreach workers dealing with preventive, promotive, and rehabilitative care
ItŌĆÖs structured in a step-by-step format, featuring tables, case examples, and simplified explanations tailored for easy understanding and classroom delivery.How to Implement Least Package Removal Strategy in Odoo 18 Inventory
How to Implement Least Package Removal Strategy in Odoo 18 InventoryCeline George
╠²
In Odoo, the least package removal strategy is a feature designed to optimize inventory management by minimizing the number of packages open to fulfill the orders. This strategy is particularly useful for the business that deals with products packages in various quantities such as boxes, cartons or palettes. june 10 2025 ppt for madden on art science is over.pptx
june 10 2025 ppt for madden on art science is over.pptxroger malina
╠²
art science is over -talk by roger malina for jack madden groupHow to Configure Vendor Management in Lunch App of Odoo 18
How to Configure Vendor Management in Lunch App of Odoo 18Celine George
╠²
The Vendor management in the Lunch app of Odoo 18 is the central hub for managing all aspects of the restaurants or caterers that provide food for your employees. Paper 107 | From Watchdog to Lapdog: IshiguroŌĆÖs Fiction and the Rise of ŌĆ£Godi...
Paper 107 | From Watchdog to Lapdog: IshiguroŌĆÖs Fiction and the Rise of ŌĆ£Godi...Rajdeep Bavaliya
╠²
Dive into a captivating analysis where Kazuo IshiguroŌĆÖs nuanced fiction meets the stark realities of postŌĆæ2014 Indian journalism. Uncover how ŌĆ£Godi MediaŌĆØ turned from watchdog to lapdog, echoing the moral compromises of IshiguroŌĆÖs protagonists. WeŌĆÖll draw parallels between restrained narrative silences and sensationalist headlinesŌĆöare our media heroes or traitors? DonŌĆÖt forget to follow for more deep dives!
M.A. Sem - 2 | Presentation
Presentation Season - 2
Paper - 107: The Twentieth Century Literature: From World War II to the End of the Century
Submitted Date: April 4, 2025
Paper Name: The Twentieth Century Literature: From World War II to the End of the Century
Topic: From Watchdog to Lapdog: IshiguroŌĆÖs Fiction and the Rise of ŌĆ£Godi MediaŌĆØ in Post-2014 Indian Journalism
[Please copy the link and paste it into any web browser to access the content.]
Video Link: https://youtu.be/kIEqwzhHJ54
For a more in-depth discussion of this presentation, please visit the full blog post at the following link: https://rajdeepbavaliya2.blogspot.com/2025/04/from-watchdog-to-lapdog-ishiguro-s-fiction-and-the-rise-of-godi-media-in-post-2014-indian-journalism.html
Please visit this blog to explore additional presentations from this season:
Hashtags:
#GodiMedia #Ishiguro #MediaEthics #WatchdogVsLapdog #IndianJournalism #PressFreedom #LiteraryCritique #AnArtistOfTheFloatingWorld #MediaCapture #KazuoIshiguro
Keyword Tags:
Godi Media, Ishiguro fiction, post-2014 Indian journalism, media capture, Kazuo Ishiguro analysis, watchdog to lapdog, press freedom India, media ethics, literature and media, An Artist of the Floating WorldBattle of Bookworms 2025 - U25 Literature Quiz by Pragya
Battle of Bookworms 2025 - U25 Literature Quiz by Pragya Pragya - UEM Kolkata Quiz Club
╠²
Battle of Bookworms is a literature quiz organized by Pragya, UEM Kolkata, as part of their cultural fest Ecstasia. Curated by quizmasters Drisana Bhattacharyya, Argha Saha, and Aniket Adhikari, the quiz was a dynamic mix of classical literature, modern writing, mythology, regional texts, and experimental literary forms. It began with a 20-question prelim round where ŌĆśstar questionsŌĆÖ played a key tie-breaking role. The top 8 teams moved into advanced rounds, where they faced audio-visual challenges, pounce/bounce formats, immunity tokens, and theme-based risk-reward questions. From Orwell and Hemingway to Tagore and Sarala Das, the quiz traversed a global and Indian literary landscape. Unique rounds explored slipstream fiction, constrained writing, adaptations, and true crime literature. It included signature IDs, character identifications, and open-pounce selections. Questions were crafted to test contextual understanding, narrative knowledge, and authorial intent, making the quiz both intellectually rewarding and culturally rich. Battle of Bookworms proved literature quizzes can be insightful, creative, and deeply enjoyable for all.Capitol Doctoral Presentation -June 2025.pptx
Capitol Doctoral Presentation -June 2025.pptxCapitolTechU
╠²
║▌║▌▀Żs from a Capitol Technology University presentation covering doctoral programs offered by the university. All programs are online, and regionally accredited. The presentation covers degree program details, tuition, financial aid and the application process.Non-Communicable Diseases and National Health Programs ŌĆō Unit 10 | B.Sc Nursi...
Non-Communicable Diseases and National Health Programs ŌĆō Unit 10 | B.Sc Nursi...RAKESH SAJJAN
╠²
This PowerPoint presentation is prepared for Unit 10 ŌĆō Non-Communicable Diseases and National Health Programs, as per the 5th Semester B.Sc Nursing syllabus outlined by the Indian Nursing Council (INC) under the subject Community Health Nursing ŌĆō I.
This unit focuses on equipping students with knowledge of the causes, prevention, and control of non-communicable diseases (NCDs), which are a major public health challenge in India. The presentation emphasizes the nurseŌĆÖs role in early detection, screening, management, and referral services under national-level programs.
¤ö╣ Key Topics Included:
Definition, burden, and impact of NCDs in India
Epidemiology, risk factors, signs/symptoms, prevention, and management of:
Diabetes Mellitus
Hypertension
Cardiovascular Diseases
Stroke & Obesity
Thyroid Disorders
Blindness
Deafness
Injuries and Accidents (incl. road traffic injuries and trauma guidelines)
NCD-2 Cancers:
Breast Cancer
Cervical Cancer
Oral Cancer
Risk factors, screening, diagnosis, early signs, referral & palliative care
Role of nurse in screening, referral, counseling, and continuum of care
National Programs:
National Program for Prevention and Control of Cancer, Diabetes, Cardiovascular Diseases and Stroke (NPCDCS)
National Program for Control of Blindness
National Program for Prevention and Control of Deafness
National Tobacco Control Program (NTCP)
Introduction to Universal Health Coverage and Ayushman Bharat
Use of standard treatment protocols and referral flowcharts
This presentation is ideal for:
Classroom lectures, field assignments, health education planning, and student projects
Preparing for university exams, class tests, and community field postingsPaper 108 | ThoreauŌĆÖs Influence on Gandhi: The Evolution of Civil Disobedience
Paper 108 | ThoreauŌĆÖs Influence on Gandhi: The Evolution of Civil DisobedienceRajdeep Bavaliya
╠²
Dive into the powerful journey from ThoreauŌĆÖs 19thŌĆæcentury essay to GandhiŌĆÖs mass movement, and discover how one manŌĆÖs moral stand became the backbone of nonviolent resistance worldwide. Learn how conscience met strategy to spark revolutions, and why their legacy still inspires todayŌĆÖs social justice warriors. Uncover the evolution of civil disobedience. DonŌĆÖt forget to like, share, and follow for more deep dives into the ideas that changed the world.
M.A. Sem - 2 | Presentation
Presentation Season - 2
Paper - 108: The American Literature
Submitted Date: April 2, 2025
Paper Name: The American Literature
Topic: ThoreauŌĆÖs Influence on Gandhi: The Evolution of Civil Disobedience
[Please copy the link and paste it into any web browser to access the content.]
Video Link: https://youtu.be/HXeq6utg7iQ
For a more in-depth discussion of this presentation, please visit the full blog post at the following link: https://rajdeepbavaliya2.blogspot.com/2025/04/thoreau-s-influence-on-gandhi-the-evolution-of-civil-disobedience.html
Please visit this blog to explore additional presentations from this season:
Hashtags:
#CivilDisobedience #ThoreauToGandhi #NonviolentResistance #Satyagraha #Transcendentalism #SocialJustice #HistoryUncovered #GandhiLegacy #ThoreauInfluence #PeacefulProtest
Keyword Tags:
civil disobedience, Thoreau, Gandhi, Satyagraha, nonviolent protest, transcendentalism, moral resistance, Gandhi Thoreau connection, social change, political philosophyICT-8-Module-REVISED-K-10-CURRICULUM.pdf
ICT-8-Module-REVISED-K-10-CURRICULUM.pdfpenafloridaarlyn
╠²
In this module, you will discover how digital tools, systems, and platforms empower people, businesses, and communities in the modern world. As 21st-century learners, you are part of a generation that lives and learns in a digital environment. This module is designed to guide you in exploring how ICT serves as a powerful toolŌĆönot only for communication but also for innovation, entrepreneurship, and responsible citizenship. Throughout this learning material, you will examine how ICT is used in real-world scenarios such as online marketing, digital citizenship, and legal and ethical issues in technology use. YouŌĆÖll gain practical knowledge and skills, from creating websites and managing e-commerce platforms, to analyzing data and practicing safe and responsible behavior online.
By engaging with the lessons, activities, and performance tasks in this module, you will become more than just a technology userŌĆöyou will be a responsible, informed, and empowered digital citizen ready to thrive in todayŌĆÖs interconnected world.
LetŌĆÖs begin this journey and unlock the full potential of ICT in your everyday life!
Publishing Your Memoir with Brooke Warner
Publishing Your Memoir with Brooke WarnerBrooke Warner
╠²
Brooke Warner presents on getting published - traditional, hybrid, and self-publishing.
www.memoirnation.comPlate Tectonic Boundaries and Continental Drift Theory
Plate Tectonic Boundaries and Continental Drift TheoryMarie
╠²
This 28 slide presentation covers the basics of plate tectonics and continental drift theory. It is an effective introduction into a full plate tectonics unit study, but does not cover faults, stress, seismic waves, or seafloor spreading.
To download PDF, visit The Homeschool Daily. We will be uploading more slideshows to follow this one. Blessings, Marie GEOGRAPHY-Study Material [ Class 10th] .pdf
GEOGRAPHY-Study Material [ Class 10th] .pdfSHERAZ AHMAD LONE
╠²
"Geography Study Material for Class 10th" provides a comprehensive and easy-to-understand resource for key topics like Resources & Development, Water Resources, Agriculture, Minerals & Energy, Manufacturing Industries, and Lifelines of the National Economy. Designed as per the latest NCERT/JKBOSE syllabus, it includes notes, maps, diagrams, and MODEL question Paper to help students excel in exams. Whether revising for exams or strengthening conceptual clarity, this material ensures effective learning and high scores. Perfect for last-minute revisions and structured study sessions.Sustainable Innovation with Immersive Learning
Sustainable Innovation with Immersive LearningLeonel Morgado
╠²
Prof. Leonel and Prof. Dennis approached educational uses, practices, and strategies of using immersion as a lens to interpret, design, and planning educational activities in a sustainable way. Rather than one-off gimmicks, the intent is to enable instructors (and institutions) to be able to include them in their regular activities, including the ability to evaluate and redesign them.
Immersion as a phenomenon enables interpreting pedagogical activities in a learning-agnostic way: you take a stance on the learning theory to follow, and leverage immersion to envision and guide your practice.FIRST DAY HIGH orientation for mapeh subject in grade 10.pptx
FIRST DAY HIGH orientation for mapeh subject in grade 10.pptxGlysdiEelesor1
╠²
basic orientation of the first day highPaper 107 | From Watchdog to Lapdog: IshiguroŌĆÖs Fiction and the Rise of ŌĆ£Godi...
Paper 107 | From Watchdog to Lapdog: IshiguroŌĆÖs Fiction and the Rise of ŌĆ£Godi...Rajdeep Bavaliya
╠²
Ad
NORMAL CURVE DISTRIBUTION OR BALANCE CURVE
- 3. z Is this normal? Why do you think its not normal?
- 4. z Is this normal? Why should we normalize this kind of practice?
- 5. z Is this normal? Why should we NOT normalize this kind of behavior?
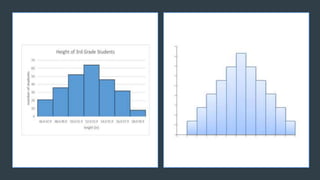
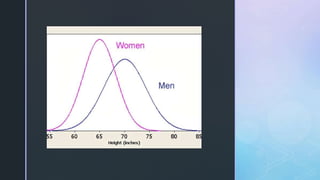
- 6. z Example 1. Height Distribution of Grade 3 students in Wangyu Elementary School.
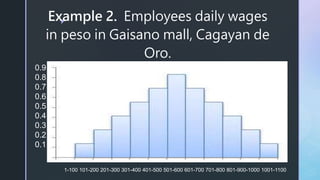
- 7. z Example 2. Employees daily wages in peso in Gaisano mall, Cagayan de Oro. 0.9 0.8 0.7 0.6 0.5 0.4 0.3 0.2 0.1 1-100 101-200 201-300 301-400 401-500 501-600 601-700 701-800 801-900-1000 1001-1100
- 8. z
- 9. z
- 10. z
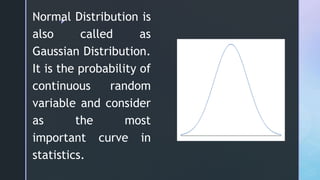
- 11. z Normal Distribution is also called as Gaussian Distribution. It is the probability of continuous random variable and consider as the most important curve in statistics.
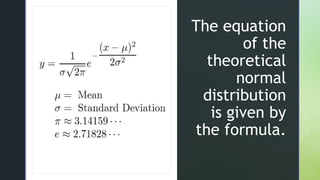
- 12. z z The equation of the theoretical normal distribution is given by the formula.
- 13. z
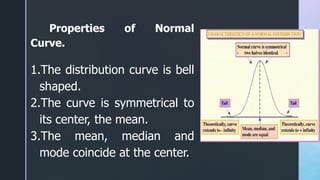
- 14. Properties of Normal Curve. 1.The distribution curve is bell shaped. 2.The curve is symmetrical to its center, the mean. 3.The mean, median and mode coincide at the center.
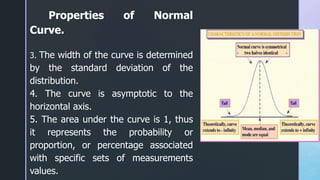
- 15. Properties of Normal Curve. 3. The width of the curve is determined by the standard deviation of the distribution. 4. The curve is asymptotic to the horizontal axis. 5. The area under the curve is 1, thus it represents the probability or proportion, or percentage associated with specific sets of measurements values.
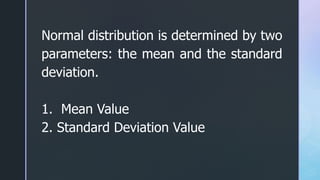
- 16. Normal distribution is determined by two parameters: the mean and the standard deviation. 1. Mean Value 2. Standard Deviation Value
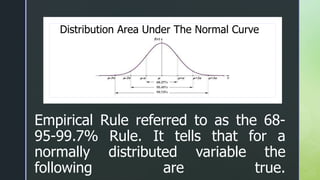
- 17. z z Empirical Rule referred to as the 68- 95-99.7% Rule. It tells that for a normally distributed variable the following are true. Distribution Area Under The Normal Curve
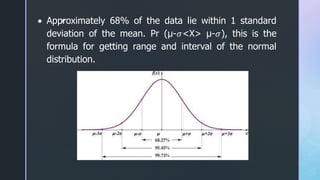
- 18. z ’éĘ Approximately 68% of the data lie within 1 standard deviation of the mean. Pr (╬╝-Ø£Ä<X> ╬╝-Ø£Ä), this is the formula for getting range and interval of the normal distribution.
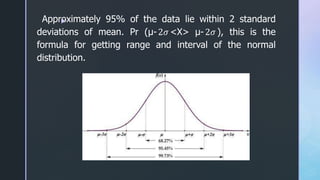
- 19. z Approximately 95% of the data lie within 2 standard deviations of mean. Pr (╬╝-2Ø£Ä <X> ╬╝-2Ø£Ä ), this is the formula for getting range and interval of the normal distribution.
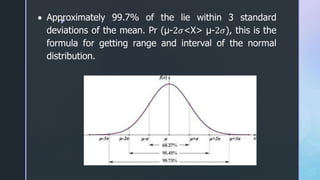
- 20. z ’éĘ Approximately 99.7% of the lie within 3 standard deviations of the mean. Pr (╬╝-2Ø£Ä<X> ╬╝-2Ø£Ä), this is the formula for getting range and interval of the normal distribution.
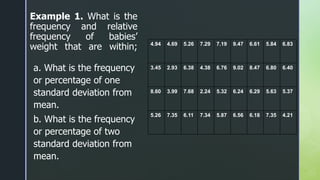
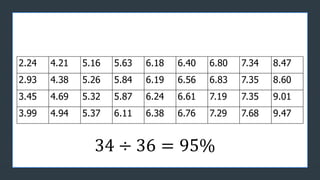
- 21. z z Example 1. What is the frequency and relative frequency of babiesŌĆÖ weight that are within; a. What is the frequency or percentage of one standard deviation from mean. b. What is the frequency or percentage of two standard deviation from mean. 4.94 4.69 5.26 7.29 7.19 9.47 6.61 5.84 6.83 3.45 2.93 6.38 4.38 6.76 9.02 8.47 6.80 6.40 8.60 3.99 7.68 2.24 5.32 6.24 6.29 5.63 5.37 5.26 7.35 6.11 7.34 5.87 6.56 6.18 7.35 4.21
- 22. z
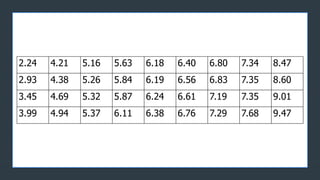
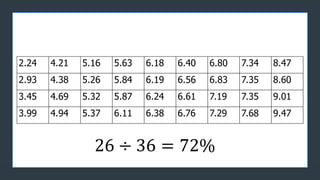
- 23. z 2.24 4.21 5.16 5.63 6.18 6.40 6.80 7.34 8.47 2.93 4.38 5.26 5.84 6.19 6.56 6.83 7.35 8.60 3.45 4.69 5.32 5.87 6.24 6.61 7.19 7.35 9.01 3.99 4.94 5.37 6.11 6.38 6.76 7.29 7.68 9.47
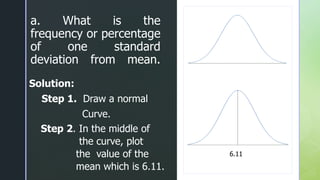
- 24. z z a. What is the frequency or percentage of one standard deviation from mean. Solution: Step 1. Draw a normal Curve. Step 2. In the middle of the curve, plot the value of the mean which is 6.11. 6.11
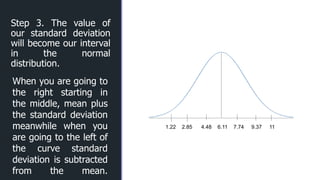
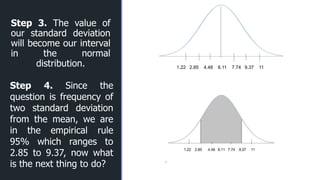
- 25. z z Step 3. The value of our standard deviation will become our interval in the normal distribution. 1.22 2.85 4.48 6.11 7.74 9.37 11 When you are going to the right starting in the middle, mean plus the standard deviation meanwhile when you are going to the left of the curve standard deviation is subtracted from the mean.
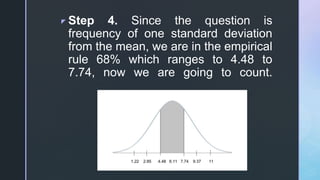
- 26. z Step 4. Since the question is frequency of one standard deviation from the mean, we are in the empirical rule 68% which ranges to 4.48 to 7.74, now we are going to count.
- 27. z 2.24 4.21 5.16 5.63 6.18 6.40 6.80 7.34 8.47 2.93 4.38 5.26 5.84 6.19 6.56 6.83 7.35 8.60 3.45 4.69 5.32 5.87 6.24 6.61 7.19 7.35 9.01 3.99 4.94 5.37 6.11 6.38 6.76 7.29 7.68 9.47 26 ├Ę 36 = 72% ├Ę├Ę
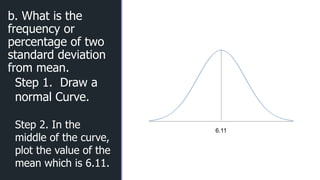
- 28. z z b. What is the frequency or percentage of two standard deviation from mean. 6.11 Step 1. Draw a normal Curve. Step 2. In the middle of the curve, plot the value of the mean which is 6.11.
- 29. z z Step 3. The value of our standard deviation will become our interval in the normal distribution. 1.22 2.85 4.48 6.11 7.74 9.37 11 Step 4. Since the question is frequency of two standard deviation from the mean, we are in the empirical rule 95% which ranges to 2.85 to 9.37, now what is the next thing to do?
- 30. z 2.24 4.21 5.16 5.63 6.18 6.40 6.80 7.34 8.47 2.93 4.38 5.26 5.84 6.19 6.56 6.83 7.35 8.60 3.45 4.69 5.32 5.87 6.24 6.61 7.19 7.35 9.01 3.99 4.94 5.37 6.11 6.38 6.76 7.29 7.68 9.47 34 ├Ę 36 = 95% ├Ę├Ę
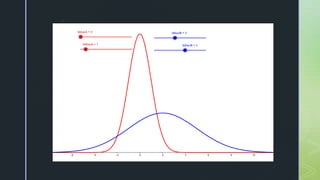
- 31. z How about if we compare two data sets with normal curve?
- 32. z
- 34. z
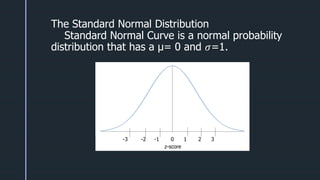
- 35. z z The Standard Normal Distribution Standard Normal Curve is a normal probability distribution that has a ╬╝= 0 and Ø£Ä=1. -3 -2 -1 0 1 2 3 z-score
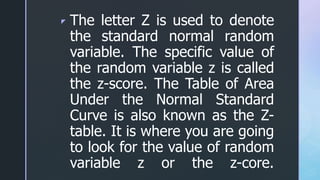
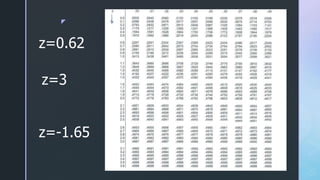
- 36. z The letter Z is used to denote the standard normal random variable. The specific value of the random variable z is called the z-score. The Table of Area Under the Normal Standard Curve is also known as the Z- table. It is where you are going to look for the value of random variable z or the z-core.
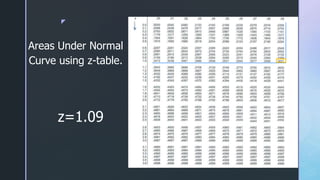
- 37. z Areas Under Normal Curve using z-table. z=1.09
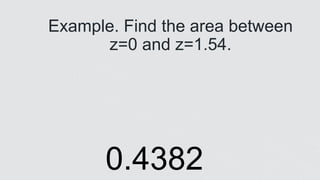
- 39. z z Example. Find the area between z=0 and z=1.54. 0.4382
- 40. z z Areas Under Standard Normal Curve Find the area between z=1.52 and z=2.5
- 41. z Find the area between z= -1.5 and z=-2.5
- 42. z LetŌĆÖs try this ! 1. Anna is planning to enroll in MSU taking up Bachelor of Science in Civil Engineering. The average academic performance of all the students 80 and a standard deviation of 5, it follows a normal distribution. a. Sketch a Normal Curve using Empirical Rule and describe the curves. 2. Find the area between z=1.7 and z=2
- 43. z Let's have a short quiz. Instruction: Answer the following questions and make sure your writings clear and readable. I. Find the area under the normal curve in each of the following cases. 1. Find the Area between z= -1.36 and z=2.25. 2. To the right of z=1.85 3. To the left z=-0.45
- 44. z II. Sketch a normal curve. 1. Mean of 15 and a standard deviation of 4. On same axis, sketch another curve that has a mean of 25 and a standard deviation of 4. Describe the two random curves. III. Essay 1. State a real-life situation that a normal curve distribution can be used.