Presentation1.ppt.education and learning
Download as pptx, pdf0 likes4 views
The document discusses the concept of normal distribution, defining it as a fundamental statistical curve characterized by its bell shape, symmetry, and properties related to mean and standard deviation. It explains the empirical rule, detailing the percentages of data that fall within one, two, and three standard deviations from the mean. Various examples, formulas for calculating frequencies, and exercises to apply these concepts are also included.
1 of 43
Download to read offline


Ad
Recommended
statistics...normal/ distribution curvee
statistics...normal/ distribution curveeWORLDMUSICDEFINER
╠²
The document explains normal distribution, also known as Gaussian distribution, highlighting its key properties and the empirical rule stating that approximately 68%, 95%, and 99.7% of data fall within one, two, and three standard deviations from the mean, respectively. It includes examples related to height and wages, as well as explanations on calculating frequencies and percentages within these standard deviations. Furthermore, it introduces the concept of z-scores in the standard normal distribution and includes a quiz section for practical application of the concepts discussed.NORMAL CURVE DISTRIBUTION OR BALANCE CURVE
NORMAL CURVE DISTRIBUTION OR BALANCE CURVEWORLDMUSICDEFINER
╠²
Here are the answers to the quiz questions:
I.
1. Area = 0.4165 - 0.0253 = 0.3912
2. Area = 0.9646
3. Area = 0.3275
II.
[Sketches the two normal curves described]
The first curve is centered at 15 with width determined by Žā of 4. The second curve is centered at 25 with the same width determined by Žā of 4.
III.
One real-life situation where a normal distribution can be used is to model human height in a population. Since most people's heights cluster around an average with decreasing frequencies further from the average in both directions, height follows an approximateStatistics and Probability- NORMAL DISTRIBUTION.pptx
Statistics and Probability- NORMAL DISTRIBUTION.pptxAshellyTugdang
╠²
The document provides an in-depth explanation of the normal distribution, its properties, and calculations involving standard deviations and probabilities. Key concepts include the relationship between the mean and standard deviation, the empirical rule, and examples demonstrating the calculation of probabilities and percentiles. It also covers the historical background of the normal curve and the use of z-scores in statistics.Nossi ch 11
Nossi ch 11lesaturner
╠²
The document summarizes key concepts about normal distributions and using z-scores. It includes examples of calculating percentages of data that fall within a certain number of standard deviations from the mean. It also discusses how to convert between standard and population normal distributions using z-scores. An example problem at the end solves for the percentage of marathon finishers with times between 285-335 minutes.Distribution................................pptx
Distribution................................pptxannarosegarcia1
╠²
.........................................Inferiential statistics .pptx
Inferiential statistics .pptxMelba Shaya Sweety
╠²
1. The document discusses the normal distribution and z-distribution (standard normal distribution). It provides definitions, properties, and examples of both.
2. The normal distribution is a bell-shaped curve that is symmetric around the mean. It is defined by its mean and standard deviation. The z-distribution is the standard normal distribution where the mean is 0 and standard deviation is 1.
3. Examples are provided to demonstrate how to calculate probabilities and find z-scores using the normal and z-distributions. Areas under the curve are calculated to find probabilities for various values in relation to the mean.REPORT MATH.pdf
REPORT MATH.pdfJelo Sunido
╠²
This document discusses frequency distributions, histograms, and the normal distribution. It provides examples of grouped and relative frequency distributions and how to construct histograms to visualize this data. It also explains key properties of the normal distribution including the empirical rule and how it relates to standard deviations from the mean. Finally, it covers how to calculate z-scores to standardize values and use z-tables to find probabilities for the standard normal distribution.The-Normal-Distribution, Statics and Pro
The-Normal-Distribution, Statics and ProGiancarloMercado2
╠²
The document discusses the normal distribution, also known as the gaussian distribution, which is a continuous probability distribution characterized by its bell-shaped curve defined by the mean (╬╝) and standard deviation (Žā). It outlines the properties of the normal distribution, including its symmetry, unimodality, and the significance of areas under the curve for probability calculations. Additionally, it explains how to derive standard scores (z-scores) and compute probabilities based on given means and standard deviations in various examples.The normal distribution and its properties.pptx
The normal distribution and its properties.pptxRodelLaman1
╠²
This document discusses the normal distribution and its key properties. It explains that a normal distribution is a continuous, bell-shaped curve that is symmetrical about the mean. It also describes some important characteristics of the normal curve, such as being asymptotic to the x-axis, having its highest point at the mean, and satisfying the 68-95-99.7% rule regarding how much of the distribution falls within a given number of standard deviations of the mean. The document then introduces the standard normal distribution and the z-score, explaining how to look up areas under the normal curve using the z-table.Chapter 7 Powerpoint
Chapter 7 PowerpointZIADALRIFAI
╠²
The document outlines the goals and key concepts of a chapter on continuous probability distributions. It discusses the differences between discrete and continuous distributions. It then focuses on the uniform, normal, and binomial distributions, explaining how to calculate probabilities and values for each. Key points covered include the mean, standard deviation, and shape of each distribution as well as how to find z-values and probabilities using the normal distribution and binomial approximation.Statistics
Statistics maamir farooq
╠²
The document discusses the normal probability distribution, also called the Gaussian distribution. It describes key properties of the normal distribution including that it is symmetrical and bell-shaped around the mean. The normal distribution is defined by its mean and standard deviation. The standard normal distribution refers to a normal distribution with a mean of 0 and standard deviation of 1. The document provides examples of how to calculate z-scores and find probabilities associated with the normal distribution.Lect. 04 Normal distribution biostatistics
Lect. 04 Normal distribution biostatisticsAsifaBhutto1
╠²
This document discusses the normal distribution, defining it as a critical statistical distribution characterized by its symmetrical, bell-shaped curve. It outlines properties such as the total area under the curve being equal to 1 and describes how observations cluster around the mean, with specific percentages falling within one, two, and three standard deviations. Additionally, it explains transformations to standard normal distribution using z-scores and identifies outliers as measurements with z-scores beyond ┬▒3.4 2 continuous probability distributionn
4 2 continuous probability distributionnLama K Banna
╠²
Here are the steps to solve this problem:
a) Find the z-score corresponding to 115 mm Hg: (115 - 85)/13 = 2.31
The proportion that is NOT severely hypertensive is 1 - P(Z >= 2.31) = 1 - 0.0103 = 0.9897
b) Find the z-score corresponding to 90 mm Hg: (90 - 85)/13 = 0.3846
The proportion that will be asked to consult a physician is P(Z >= 0.3846) = 0.6507
c) Find the z-scores corresponding to the mildly hypertensive range:
(90 - 85)/13 = 0.3846
(Stat Module 3 Normal Distribution ppt.pptx
Stat Module 3 Normal Distribution ppt.pptxMaricarDimas2
╠²
This document provides an overview of the normal distribution and its key properties. It discusses how to:
1. Illustrate a normal distribution curve and identify its mean, standard deviation, and symmetrical, bell-shaped properties.
2. Use the empirical rule to determine what percentage of the distribution falls within 1, 2, or 3 standard deviations of the mean.
3. Convert between a normal random variable and a standard normal variable, and compute probabilities and percentiles using the standard normal distribution table.-Normal-Distribution-ppt.ppt-POWER PRESENTATION ON STATISTICS AND PROBABILITY
-Normal-Distribution-ppt.ppt-POWER PRESENTATION ON STATISTICS AND PROBABILITYRODULFOVPAQUINGAN
╠²
The document provides a comprehensive overview of normal probability distributions, detailing their properties, the significance of the mean and standard deviation, and how to interpret normal curves. It also explains the transformation of data into z-scores and the calculation of areas under the standard normal curve for probability assessments. Examples throughout illustrate how to apply these concepts to determine probabilities in real-world scenarios.Normal curve
Normal curveAriston Balogbog
╠²
The normal curve, also called the bell curve, is an important probability distribution that is symmetric and asymptotic. It originated in the 18th century with the work of de Moivre and Laplace. The normal distribution is significant because psychological and educational variables often follow it approximately and it is easy for statisticians to work with mathematically. Key characteristics include being symmetric, ranging from negative to positive infinity, and following the 68-95-99.7 rule where most values fall within 1-3 standard deviations of the mean. The mean, median and mode are equal for a normal distribution.normal curve distribution biostatics course.pptx
normal curve distribution biostatics course.pptxarafatibraim
╠²
The document provides an introduction to the normal distribution and its properties, highlighting its importance in determining normal intervals for various medical tests and other traits. It explains concepts like standard scores (z scores), the empirical rule, and methods for interpreting normal curves. Additionally, it discusses practical applications and how to calculate probabilities using the standard normal distribution.statistics and probabililtyyyyyyyyyyyyyyyyyyyyyyyyyyyyyyyyyyyyyyyyyyyyyyyyyyy...
statistics and probabililtyyyyyyyyyyyyyyyyyyyyyyyyyyyyyyyyyyyyyyyyyyyyyyyyyyy...mirabuenocharizze9
╠²
bell curveThe standard normal curve & its application in biomedical sciences
The standard normal curve & its application in biomedical sciencesAbhi Manu
╠²
1) The document discusses the normal distribution and its applications in statistical inference. It is the most important probability distribution used to model many continuous variables in biomedical fields.
2) The normal distribution is characterized by its mean and standard deviation. It is perfectly symmetrical and bell-shaped. Properties of the normal curve include that about 68%, 95%, and 99.7% of the data lies within 1, 2, and 3 standard deviations of the mean, respectively.
3) The standard normal distribution is used to convert raw scores to z-scores in order to compare variables measured on different scales. Z-scores indicate how many standard deviations a score is above or below the mean and can be used to determine probabilities, percentilesCh3 Probability and The Normal Distribution
Ch3 Probability and The Normal Distribution Farhan Alfin
╠²
This document provides an introduction to probability and the normal distribution. It defines probability as the chance of an event occurring, and discusses empirical probability determined by observation. It introduces the normal distribution and its key properties including that it is symmetric and bell-shaped. The document also discusses calculating probabilities and areas under the standard normal curve, including between and outside given z-values.Normal Probability Distribution
Normal Probability Distributionmandalina landy
╠²
The document discusses properties of normal distributions and the standard normal distribution. It provides examples of finding probabilities and values associated with normal distributions. The key points are:
- Normal distributions are continuous and bell-shaped. The mean, median and mode are equal.
- The standard normal distribution has a mean of 0 and standard deviation of 1.
- Probabilities under the normal curve can be found using z-scores and the standard normal table.
- Values like z-scores can be determined by finding the corresponding cumulative area in the standard normal table.Normal distribution power point presentation
Normal distribution power point presentationJoanneValesca
╠²
Chapter 6 covers the normal distribution, including its properties, applications, and the central limit theorem. It explains how to identify normal distributions, calculate areas under the curve, and apply these principles to real-world problems involving normal variables. The chapter also emphasizes the shape of the normal distribution and introduces the standard normal distribution for simplification.NORMAL DISTRIBUTIONS CHAPTER 2 WALLACE AN
NORMAL DISTRIBUTIONS CHAPTER 2 WALLACE ANjamesandrie78
╠²
This is for grade 11 senior high school student Chapter 2 understanding the normal curve distribution
Chapter 2 understanding the normal curve distributionAntonio F. Balatar Jr.
╠²
This document discusses the normal distribution and standard normal curve. It defines key properties of the normal distribution including that it is bell-shaped and symmetrical around the mean. The standard normal curve is introduced which has a mean of 0 and standard deviation of 1. The z-score is defined as a way to locate a value within a distribution based on its mean and standard deviation. Various probabilities are associated with areas under the normal curve based on z-scores.Normal distribution
Normal distributionSonamWadhwa3
╠²
The document discusses the normal distribution, which produces a symmetrical bell-shaped curve. It has two key parameters - the mean and standard deviation. According to the empirical rule, about 68% of values in a normal distribution fall within one standard deviation of the mean, 95% within two standard deviations, and 99.7% within three standard deviations. The normal distribution is commonly used to model naturally occurring phenomena that tend to cluster around an average value, such as heights or test scores.lesson1-empowermenttechnology-161103003208.pptx
lesson1-empowermenttechnology-161103003208.pptxWORLDMUSICDEFINER
╠²
The document discusses the importance of Information and Communication Technology (ICT) and its impact on society, particularly in the Philippines, emphasizing the potential job growth in this sector. It introduces various concepts such as the evolution from Web 1.0 to Web 3.0, key trends in ICT like mobile technologies and social media, and explains fundamental terms related to these topics. Additionally, it includes lesson objectives and true/false questions to assess understanding of the material presented.Presentation1.pptx .normal curve/distribution
Presentation1.pptx .normal curve/distributionWORLDMUSICDEFINER
╠²
The document discusses normal distribution, including its properties and applications in statistics. It explains the empirical rule and provides examples involving the calculation of frequencies and areas under the normal curve using standard deviation and z-scores. Additionally, it includes exercises and quizzes to practice understanding and applying normal distribution concepts.More Related Content
Similar to Presentation1.ppt.education and learning (20)
The-Normal-Distribution, Statics and Pro
The-Normal-Distribution, Statics and ProGiancarloMercado2
╠²
The document discusses the normal distribution, also known as the gaussian distribution, which is a continuous probability distribution characterized by its bell-shaped curve defined by the mean (╬╝) and standard deviation (Žā). It outlines the properties of the normal distribution, including its symmetry, unimodality, and the significance of areas under the curve for probability calculations. Additionally, it explains how to derive standard scores (z-scores) and compute probabilities based on given means and standard deviations in various examples.The normal distribution and its properties.pptx
The normal distribution and its properties.pptxRodelLaman1
╠²
This document discusses the normal distribution and its key properties. It explains that a normal distribution is a continuous, bell-shaped curve that is symmetrical about the mean. It also describes some important characteristics of the normal curve, such as being asymptotic to the x-axis, having its highest point at the mean, and satisfying the 68-95-99.7% rule regarding how much of the distribution falls within a given number of standard deviations of the mean. The document then introduces the standard normal distribution and the z-score, explaining how to look up areas under the normal curve using the z-table.Chapter 7 Powerpoint
Chapter 7 PowerpointZIADALRIFAI
╠²
The document outlines the goals and key concepts of a chapter on continuous probability distributions. It discusses the differences between discrete and continuous distributions. It then focuses on the uniform, normal, and binomial distributions, explaining how to calculate probabilities and values for each. Key points covered include the mean, standard deviation, and shape of each distribution as well as how to find z-values and probabilities using the normal distribution and binomial approximation.Statistics
Statistics maamir farooq
╠²
The document discusses the normal probability distribution, also called the Gaussian distribution. It describes key properties of the normal distribution including that it is symmetrical and bell-shaped around the mean. The normal distribution is defined by its mean and standard deviation. The standard normal distribution refers to a normal distribution with a mean of 0 and standard deviation of 1. The document provides examples of how to calculate z-scores and find probabilities associated with the normal distribution.Lect. 04 Normal distribution biostatistics
Lect. 04 Normal distribution biostatisticsAsifaBhutto1
╠²
This document discusses the normal distribution, defining it as a critical statistical distribution characterized by its symmetrical, bell-shaped curve. It outlines properties such as the total area under the curve being equal to 1 and describes how observations cluster around the mean, with specific percentages falling within one, two, and three standard deviations. Additionally, it explains transformations to standard normal distribution using z-scores and identifies outliers as measurements with z-scores beyond ┬▒3.4 2 continuous probability distributionn
4 2 continuous probability distributionnLama K Banna
╠²
Here are the steps to solve this problem:
a) Find the z-score corresponding to 115 mm Hg: (115 - 85)/13 = 2.31
The proportion that is NOT severely hypertensive is 1 - P(Z >= 2.31) = 1 - 0.0103 = 0.9897
b) Find the z-score corresponding to 90 mm Hg: (90 - 85)/13 = 0.3846
The proportion that will be asked to consult a physician is P(Z >= 0.3846) = 0.6507
c) Find the z-scores corresponding to the mildly hypertensive range:
(90 - 85)/13 = 0.3846
(Stat Module 3 Normal Distribution ppt.pptx
Stat Module 3 Normal Distribution ppt.pptxMaricarDimas2
╠²
This document provides an overview of the normal distribution and its key properties. It discusses how to:
1. Illustrate a normal distribution curve and identify its mean, standard deviation, and symmetrical, bell-shaped properties.
2. Use the empirical rule to determine what percentage of the distribution falls within 1, 2, or 3 standard deviations of the mean.
3. Convert between a normal random variable and a standard normal variable, and compute probabilities and percentiles using the standard normal distribution table.-Normal-Distribution-ppt.ppt-POWER PRESENTATION ON STATISTICS AND PROBABILITY
-Normal-Distribution-ppt.ppt-POWER PRESENTATION ON STATISTICS AND PROBABILITYRODULFOVPAQUINGAN
╠²
The document provides a comprehensive overview of normal probability distributions, detailing their properties, the significance of the mean and standard deviation, and how to interpret normal curves. It also explains the transformation of data into z-scores and the calculation of areas under the standard normal curve for probability assessments. Examples throughout illustrate how to apply these concepts to determine probabilities in real-world scenarios.Normal curve
Normal curveAriston Balogbog
╠²
The normal curve, also called the bell curve, is an important probability distribution that is symmetric and asymptotic. It originated in the 18th century with the work of de Moivre and Laplace. The normal distribution is significant because psychological and educational variables often follow it approximately and it is easy for statisticians to work with mathematically. Key characteristics include being symmetric, ranging from negative to positive infinity, and following the 68-95-99.7 rule where most values fall within 1-3 standard deviations of the mean. The mean, median and mode are equal for a normal distribution.normal curve distribution biostatics course.pptx
normal curve distribution biostatics course.pptxarafatibraim
╠²
The document provides an introduction to the normal distribution and its properties, highlighting its importance in determining normal intervals for various medical tests and other traits. It explains concepts like standard scores (z scores), the empirical rule, and methods for interpreting normal curves. Additionally, it discusses practical applications and how to calculate probabilities using the standard normal distribution.statistics and probabililtyyyyyyyyyyyyyyyyyyyyyyyyyyyyyyyyyyyyyyyyyyyyyyyyyyy...
statistics and probabililtyyyyyyyyyyyyyyyyyyyyyyyyyyyyyyyyyyyyyyyyyyyyyyyyyyy...mirabuenocharizze9
╠²
bell curveThe standard normal curve & its application in biomedical sciences
The standard normal curve & its application in biomedical sciencesAbhi Manu
╠²
1) The document discusses the normal distribution and its applications in statistical inference. It is the most important probability distribution used to model many continuous variables in biomedical fields.
2) The normal distribution is characterized by its mean and standard deviation. It is perfectly symmetrical and bell-shaped. Properties of the normal curve include that about 68%, 95%, and 99.7% of the data lies within 1, 2, and 3 standard deviations of the mean, respectively.
3) The standard normal distribution is used to convert raw scores to z-scores in order to compare variables measured on different scales. Z-scores indicate how many standard deviations a score is above or below the mean and can be used to determine probabilities, percentilesCh3 Probability and The Normal Distribution
Ch3 Probability and The Normal Distribution Farhan Alfin
╠²
This document provides an introduction to probability and the normal distribution. It defines probability as the chance of an event occurring, and discusses empirical probability determined by observation. It introduces the normal distribution and its key properties including that it is symmetric and bell-shaped. The document also discusses calculating probabilities and areas under the standard normal curve, including between and outside given z-values.Normal Probability Distribution
Normal Probability Distributionmandalina landy
╠²
The document discusses properties of normal distributions and the standard normal distribution. It provides examples of finding probabilities and values associated with normal distributions. The key points are:
- Normal distributions are continuous and bell-shaped. The mean, median and mode are equal.
- The standard normal distribution has a mean of 0 and standard deviation of 1.
- Probabilities under the normal curve can be found using z-scores and the standard normal table.
- Values like z-scores can be determined by finding the corresponding cumulative area in the standard normal table.Normal distribution power point presentation
Normal distribution power point presentationJoanneValesca
╠²
Chapter 6 covers the normal distribution, including its properties, applications, and the central limit theorem. It explains how to identify normal distributions, calculate areas under the curve, and apply these principles to real-world problems involving normal variables. The chapter also emphasizes the shape of the normal distribution and introduces the standard normal distribution for simplification.NORMAL DISTRIBUTIONS CHAPTER 2 WALLACE AN
NORMAL DISTRIBUTIONS CHAPTER 2 WALLACE ANjamesandrie78
╠²
This is for grade 11 senior high school student Chapter 2 understanding the normal curve distribution
Chapter 2 understanding the normal curve distributionAntonio F. Balatar Jr.
╠²
This document discusses the normal distribution and standard normal curve. It defines key properties of the normal distribution including that it is bell-shaped and symmetrical around the mean. The standard normal curve is introduced which has a mean of 0 and standard deviation of 1. The z-score is defined as a way to locate a value within a distribution based on its mean and standard deviation. Various probabilities are associated with areas under the normal curve based on z-scores.Normal distribution
Normal distributionSonamWadhwa3
╠²
The document discusses the normal distribution, which produces a symmetrical bell-shaped curve. It has two key parameters - the mean and standard deviation. According to the empirical rule, about 68% of values in a normal distribution fall within one standard deviation of the mean, 95% within two standard deviations, and 99.7% within three standard deviations. The normal distribution is commonly used to model naturally occurring phenomena that tend to cluster around an average value, such as heights or test scores.statistics and probabililtyyyyyyyyyyyyyyyyyyyyyyyyyyyyyyyyyyyyyyyyyyyyyyyyyyy...
statistics and probabililtyyyyyyyyyyyyyyyyyyyyyyyyyyyyyyyyyyyyyyyyyyyyyyyyyyy...mirabuenocharizze9
╠²
More from WORLDMUSICDEFINER (6)
lesson1-empowermenttechnology-161103003208.pptx
lesson1-empowermenttechnology-161103003208.pptxWORLDMUSICDEFINER
╠²
The document discusses the importance of Information and Communication Technology (ICT) and its impact on society, particularly in the Philippines, emphasizing the potential job growth in this sector. It introduces various concepts such as the evolution from Web 1.0 to Web 3.0, key trends in ICT like mobile technologies and social media, and explains fundamental terms related to these topics. Additionally, it includes lesson objectives and true/false questions to assess understanding of the material presented.Presentation1.pptx .normal curve/distribution
Presentation1.pptx .normal curve/distributionWORLDMUSICDEFINER
╠²
The document discusses normal distribution, including its properties and applications in statistics. It explains the empirical rule and provides examples involving the calculation of frequencies and areas under the normal curve using standard deviation and z-scores. Additionally, it includes exercises and quizzes to practice understanding and applying normal distribution concepts.MAED 111.ppt emergencies in education...
MAED 111.ppt emergencies in education...WORLDMUSICDEFINER
╠²
The document outlines the importance of education in emergencies, defining various forms of emergencies and their impacts on educational access and quality. It emphasizes that education can provide critical protection for children during crises, fostering resilience and preparing communities for future challenges. Moreover, it discusses the role of educational technology in enhancing learning opportunities and psychosocial well-being in affected regions, alongside the need for effective support systems for educators.MAED 109 emergencies and disasters in education am
MAED 109 emergencies and disasters in education amWORLDMUSICDEFINER
╠²
The document outlines the major provisions and penalties under the Republic Act No. 10173, known as the Data Privacy Act, focusing on unauthorized processing and accessing of personal information. It provides specific penalties for various offenses including unauthorized processing, negligence, improper disposal of information, and unauthorized disclosure of personal data with stipulations for heavier penalties in cases involving numerous victims or public officers. Additionally, it includes examples of legal cases that highlight violations of the data privacy law, showcasing its application and enforcement.leadership and management and theorieories
leadership and management and theorieoriesWORLDMUSICDEFINER
╠²
The document outlines various leadership theories including behavioral, participative, management, and relationship theories, emphasizing the actions and connections of leaders with their followers. It provides examples of notable leaders who embody these theories, such as Mahatma Gandhi and Nelson Mandela, while also highlighting key characteristics of effective leadership. The conclusion stresses the importance of mutual trust and understanding in fostering creativity and inspiration within organizations.NORMAL CURVE OR NORMAL DISTRIBUTION-MAED
NORMAL CURVE OR NORMAL DISTRIBUTION-MAEDWORLDMUSICDEFINER
╠²
The document discusses input/output design, emphasizing the importance of accurately identifying outputs to meet information requirements and designing reports for effective user interaction. It outlines objectives and activities involved in input design, such as error avoidance and data collection, while also detailing output design specifications, including preferred presentation formats like tabular and graphical. The document concludes with the importance of defining output design specifications for improved communication of past, present, and future information.Ad
Recently uploaded (20)
Paper 109 | Archetypal Journeys in ŌĆśInterstellarŌĆÖ: Exploring Universal Themes...
Paper 109 | Archetypal Journeys in ŌĆśInterstellarŌĆÖ: Exploring Universal Themes...Rajdeep Bavaliya
╠²
Get ready to embark on a cosmic quest as we unpack the archetypal power behind Christopher NolanŌĆÖs ŌĆśInterstellar.ŌĆÖ Discover how heroŌĆÖs journey tropes, mythic symbols like wormholes and tesseracts, and themes of love, sacrifice, and environmental urgency shape this epic odyssey. Whether youŌĆÖre a film theory buff or a casual viewer, youŌĆÖll learn why CooperŌĆÖs journey resonates with timeless mythsŌĆöand what it means for our own future. Smash that like button, and follow for more deep dives into cinemaŌĆÖs greatest stories!
M.A. Sem - 2 | Presentation
Presentation Season - 2
Paper - 109: Literary Theory & Criticism and Indian Aesthetics
Submitted Date: April 5, 2025
Paper Name: Literary Theory & Criticism and Indian Aesthetics
Topic: Archetypal Journeys in ŌĆśInterstellarŌĆÖ: Exploring Universal Themes in NolanŌĆÖs Cosmic Odyssey
[Please copy the link and paste it into any web browser to access the content.]
Video Link: https://youtu.be/vHLaLZPHumk
For a more in-depth discussion of this presentation, please visit the full blog post at the following link: https://rajdeepbavaliya2.blogspot.com/2025/04/archetypal-journeys-in-interstellar-exploring-universal-themes-in-nolan-s-cosmic-odyssey.html
Please visit this blog to explore additional presentations from this season:
Hashtags:
#ChristopherNolan #Interstellar #NolanFilms #HeroJourney #CosmicOdyssey #FilmTheory #ArchetypalCriticism #SciFiCinema #TimeDilation #EnvironmentalCinema #MythicStorytelling
Keyword Tags:
Interstellar analysis, Christopher Nolan archetypes, heroŌĆÖs journey explained, wormhole symbolism, tesseract meaning, myth in sci-fi, cinematic archetypes, environmental themes film, love across time, Nolan film breakdownLDMMIA GRAD Student Check-in Orientation Sampler
LDMMIA GRAD Student Check-in Orientation SamplerLDM & Mia eStudios
╠²
Completed Tuesday June 10th.
An Orientation Sampler of 8 pages.
It helps to understand the text behind anything. This improves our performance and confidence.
Your training will be mixed media. Includes Rehab Intro and Meditation vods, all sold separately.
Editing our Vods & New Shop.
Retail under $30 per item. Store Fees will apply. Digital Should be low cost.
I am still editing the package. I wont be done until probably July? However; Orientation and Lecture 1 (Videos) will be available soon. Media will vary between PDF and Instruction Videos.
Thank you for attending our free workshops. Those can be used with any Reiki Yoga training package. Traditional Reiki does host rules and ethics. Its silent and within the JP Culture/Area/Training/Word of Mouth. It allows remote healing but thereŌĆÖs limits for practitioners and masters. We are not allowed to share certain secrets/tools. Some content is designed only for ŌĆ£MastersŌĆØ. Some yoga are similar like the Kriya Yoga-Church (Vowed Lessons). We will review both Reiki and Yoga (Master symbols) later on. Sounds Simple but these things host Energy Power/Protection.
Imagine This package will be a supplement or upgrade for professional Reiki. You can create any style you need.
ŌÖźŌÖźŌÖź
ŌĆó* ╠ü ╠ł ╠¦.ŌĆó
(Job) Tech for students: In short, high speed is essential. (Space, External Drives, virtual clouds)
Fast devices and desktops are important. Please upgrade your technology and office as needed and timely. - MIA J. Tech Dept (Timeless)
ŌÖźŌÖźŌÖź
ŌĆó* ╠ü ╠ł ╠¦.ŌĆó
Copyright Disclaimer 2007-2025+: These lessons are not to be copied or revised without the
AuthorŌĆÖs permission. These Lessons are designed Rev. Moore to instruct and guide students on the path to holistic health and wellness.
ItŌĆÖs about expanding your Nature Talents, gifts, even Favorite Hobbies.
ŌÖźŌÖźŌÖź
ŌĆó* ╠ü ╠ł ╠¦.ŌĆó
First, Society is still stuck in the matrix. Many of the spiritual collective, say the matrix crashed. Its now collapsing. This means anything lower, darker realms, astral, and matrix are below 5D. 5D is thee trend. ItŌĆÖs our New Dimensional plane. However; this plane takes work ethic,
integration, and self discovery. ŌÖźŌÖźŌÖź
ŌĆó* ╠ü ╠ł ╠¦.ŌĆó
We donŌĆÖt need to slave, mule, or work double shifts to fuse Reiki lol. It should blend naturally within our lifestyles. Same with Yoga. ThereŌĆÖs no
need to use all the poses/asanas. For under a decade, my fav exercises are not asanas but Pilates. ItŌĆÖs all about Yoga-meditation when using Reiki. (Breaking old myths.)
Thank You for reading our Orientation Sampler. The Workshop is 14 pages on introduction. These are a joy and effortless to produce/make.How to Implement Least Package Removal Strategy in Odoo 18 Inventory
How to Implement Least Package Removal Strategy in Odoo 18 InventoryCeline George
╠²
In Odoo, the least package removal strategy is a feature designed to optimize inventory management by minimizing the number of packages open to fulfill the orders. This strategy is particularly useful for the business that deals with products packages in various quantities such as boxes, cartons or palettes. Battle of Bookworms 2025 - U25 Literature Quiz by Pragya
Battle of Bookworms 2025 - U25 Literature Quiz by Pragya Pragya - UEM Kolkata Quiz Club
╠²
Battle of Bookworms is a literature quiz organized by Pragya, UEM Kolkata, as part of their cultural fest Ecstasia. Curated by quizmasters Drisana Bhattacharyya, Argha Saha, and Aniket Adhikari, the quiz was a dynamic mix of classical literature, modern writing, mythology, regional texts, and experimental literary forms. It began with a 20-question prelim round where ŌĆśstar questionsŌĆÖ played a key tie-breaking role. The top 8 teams moved into advanced rounds, where they faced audio-visual challenges, pounce/bounce formats, immunity tokens, and theme-based risk-reward questions. From Orwell and Hemingway to Tagore and Sarala Das, the quiz traversed a global and Indian literary landscape. Unique rounds explored slipstream fiction, constrained writing, adaptations, and true crime literature. It included signature IDs, character identifications, and open-pounce selections. Questions were crafted to test contextual understanding, narrative knowledge, and authorial intent, making the quiz both intellectually rewarding and culturally rich. Battle of Bookworms proved literature quizzes can be insightful, creative, and deeply enjoyable for all.Measuring, learning and applying multiplication facts.
Measuring, learning and applying multiplication facts.cgilmore6
╠²
║▌║▌▀Żs from a presentation by Professor Camilla Gilmore to the Association of Teachers of Mathematics and Mathematics Association Primary Interest group in June 2025.
This gave an overview of two studies that investigated children's multiplication fact knowledge. These studies were part of the SUM research project based at the University of Nottingham and Loughborough University. For more information see www.sumproject.org.ukPublishing Your Memoir with Brooke Warner
Publishing Your Memoir with Brooke WarnerBrooke Warner
╠²
Brooke Warner presents on getting published - traditional, hybrid, and self-publishing.
www.memoirnation.comPEST OF WHEAT SORGHUM BAJRA and MINOR MILLETS.pptx
PEST OF WHEAT SORGHUM BAJRA and MINOR MILLETS.pptxArshad Shaikh
╠²
Wheat, sorghum, and bajra (pearl millet) are susceptible to various pests that can significantly impact crop yields. Common pests include aphids, stem borers, shoot flies, and armyworms. Aphids feed on plant sap, weakening the plants, while stem borers and shoot flies damage the stems and shoots, leading to dead hearts and reduced growth. Armyworms, on the other hand, are voracious feeders that can cause extensive defoliation and grain damage. Effective management strategies, including resistant varieties, cultural practices, and targeted pesticide applications, are essential to mitigate pest damage and ensure healthy crop production.Overview of Off Boarding in Odoo 18 Employees
Overview of Off Boarding in Odoo 18 EmployeesCeline George
╠²
When an employee leaves the company, Odoo provides a streamlined offboarding process to ensure all necessary steps are taken. ICT-8-Module-REVISED-K-10-CURRICULUM.pdf
ICT-8-Module-REVISED-K-10-CURRICULUM.pdfpenafloridaarlyn
╠²
In this module, you will discover how digital tools, systems, and platforms empower people, businesses, and communities in the modern world. As 21st-century learners, you are part of a generation that lives and learns in a digital environment. This module is designed to guide you in exploring how ICT serves as a powerful toolŌĆönot only for communication but also for innovation, entrepreneurship, and responsible citizenship. Throughout this learning material, you will examine how ICT is used in real-world scenarios such as online marketing, digital citizenship, and legal and ethical issues in technology use. YouŌĆÖll gain practical knowledge and skills, from creating websites and managing e-commerce platforms, to analyzing data and practicing safe and responsible behavior online.
By engaging with the lessons, activities, and performance tasks in this module, you will become more than just a technology userŌĆöyou will be a responsible, informed, and empowered digital citizen ready to thrive in todayŌĆÖs interconnected world.
LetŌĆÖs begin this journey and unlock the full potential of ICT in your everyday life!
THERAPEUTIC COMMUNICATION included definition, characteristics, nurse patient...
THERAPEUTIC COMMUNICATION included definition, characteristics, nurse patient...parmarjuli1412
╠²
The document provides an overview of therapeutic communication, emphasizing its importance in nursing to address patient needs and establish effective relationships. THERAPEUTIC COMMUNICATION included some topics like introduction of COMMUNICATION, definition, types, process of communication, definition therapeutic communication, goal, techniques of therapeutic communication, non-therapeutic communication, few ways to improved therapeutic communication, characteristics of therapeutic communication, barrier of THERAPEUTIC RELATIONSHIP, introduction of interpersonal relationship, types of IPR, elements/ dynamics of IPR, introduction of therapeutic nurse patient relationship, definition, purpose, elements/characteristics , and phases of therapeutic communication, definition of Johari window, uses, what actually model represent and its areas, THERAPEUTIC IMPASSES and its management in 5th semester Bsc. nursing and 2nd GNM studentsHow to Manage Multi Language for Invoice in Odoo 18
How to Manage Multi Language for Invoice in Odoo 18Celine George
╠²
Odoo supports multi-language functionality for invoices, allowing you to generate invoices in your customersŌĆÖ preferred languages. Multi-language support for invoices is crucial for businesses operating in global markets or dealing with customers from different linguistic backgrounds. 2025 June Year 9 Presentation: Subject selection.pptx
2025 June Year 9 Presentation: Subject selection.pptxmansk2
╠²
2025 June Year 9 Presentation: Subject selectionNon-Communicable Diseases and National Health Programs ŌĆō Unit 10 | B.Sc Nursi...
Non-Communicable Diseases and National Health Programs ŌĆō Unit 10 | B.Sc Nursi...RAKESH SAJJAN
╠²
This PowerPoint presentation is prepared for Unit 10 ŌĆō Non-Communicable Diseases and National Health Programs, as per the 5th Semester B.Sc Nursing syllabus outlined by the Indian Nursing Council (INC) under the subject Community Health Nursing ŌĆō I.
This unit focuses on equipping students with knowledge of the causes, prevention, and control of non-communicable diseases (NCDs), which are a major public health challenge in India. The presentation emphasizes the nurseŌĆÖs role in early detection, screening, management, and referral services under national-level programs.
¤ö╣ Key Topics Included:
Definition, burden, and impact of NCDs in India
Epidemiology, risk factors, signs/symptoms, prevention, and management of:
Diabetes Mellitus
Hypertension
Cardiovascular Diseases
Stroke & Obesity
Thyroid Disorders
Blindness
Deafness
Injuries and Accidents (incl. road traffic injuries and trauma guidelines)
NCD-2 Cancers:
Breast Cancer
Cervical Cancer
Oral Cancer
Risk factors, screening, diagnosis, early signs, referral & palliative care
Role of nurse in screening, referral, counseling, and continuum of care
National Programs:
National Program for Prevention and Control of Cancer, Diabetes, Cardiovascular Diseases and Stroke (NPCDCS)
National Program for Control of Blindness
National Program for Prevention and Control of Deafness
National Tobacco Control Program (NTCP)
Introduction to Universal Health Coverage and Ayushman Bharat
Use of standard treatment protocols and referral flowcharts
This presentation is ideal for:
Classroom lectures, field assignments, health education planning, and student projects
Preparing for university exams, class tests, and community field postingsjune 10 2025 ppt for madden on art science is over.pptx
june 10 2025 ppt for madden on art science is over.pptxroger malina
╠²
art science is over -talk by roger malina for jack madden groupUnit- 4 Biostatistics & Research Methodology.pdf
Unit- 4 Biostatistics & Research Methodology.pdfKRUTIKA CHANNE
╠²
Blocking and confounding (when a third variable, or confounder, influences both the exposure and the outcome) system for Two-level factorials (a type of experimental design where each factor (independent variable) is investigated at only two levels, typically denoted as "high" and "low" or "+1" and "-1")
Regression modeling (statistical model that estimates the relationship between one dependent variable and one or more independent variables using a line): Hypothesis testing in Simple and Multiple regression models
Introduction to Practical components of Industrial and Clinical Trials Problems: Statistical Analysis Using Excel, SPSS, MINITAB┬«’ĖÅ, DESIGN OF EXPERIMENTS, R - Online Statistical Software to Industrial and Clinical trial approachIntroduction to Generative AI and Copilot.pdf
Introduction to Generative AI and Copilot.pdfTechSoup
╠²
In this engaging and insightful two-part webinar series, where we will dive into the essentials of generative AI, address key AI concerns, and demonstrate how nonprofits can benefit from using MicrosoftŌĆÖs AI assistant, Copilot, to achieve their goals.
This event series to help nonprofits obtain Copilot skills is made possible by generous support from Microsoft.How to Configure Vendor Management in Lunch App of Odoo 18
How to Configure Vendor Management in Lunch App of Odoo 18Celine George
╠²
The Vendor management in the Lunch app of Odoo 18 is the central hub for managing all aspects of the restaurants or caterers that provide food for your employees. How to Create an Event in Odoo 18 - Odoo 18 ║▌║▌▀Żs
How to Create an Event in Odoo 18 - Odoo 18 ║▌║▌▀ŻsCeline George
╠²
Creating an event in Odoo 18 is a straightforward process that allows you to manage various aspects of your event efficiently.
Odoo 18 Events Module is a powerful tool for organizing and managing events of all sizes, from conferences and workshops to webinars and meetups. Paper 109 | Archetypal Journeys in ŌĆśInterstellarŌĆÖ: Exploring Universal Themes...
Paper 109 | Archetypal Journeys in ŌĆśInterstellarŌĆÖ: Exploring Universal Themes...Rajdeep Bavaliya
╠²
Ad
Presentation1.ppt.education and learning
- 2. z Is this normal? Why do you think its not normal?
- 3. z Is this normal? Why should we normalize this kind of practice?
- 4. z Is this normal? Why should we NOT normalize this kind of behavior? NILAIT VS NANLAIT
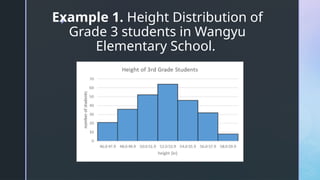
- 5. z Example 1. Height Distribution of Grade 3 students in Wangyu Elementary School.
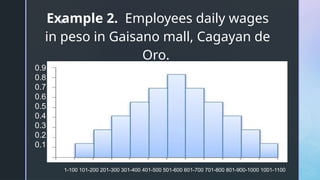
- 6. z Example 2. Employees daily wages in peso in Gaisano mall, Cagayan de Oro. 0.9 0.8 0.7 0.6 0.5 0.4 0.3 0.2 0.1 1-100 101-200 201-300 301-400 401-500 501-600 601-700 701-800 801-900-1000 1001-1100
- 7. z
- 8. z N R O M A L C U R V E
- 9. z N R O M A L C U R V E
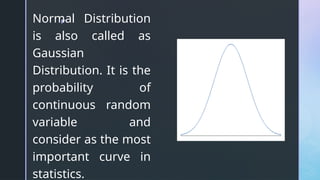
- 10. z Normal Distribution is also called as Gaussian Distribution. It is the probability of continuous random variable and consider as the most important curve in statistics.
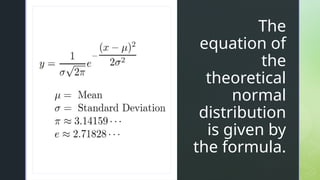
- 11. z z The equation of the theoretical normal distribution is given by the formula.
- 12. z
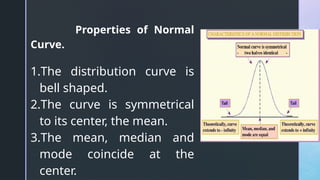
- 13. Properties of Normal Curve. 1.The distribution curve is bell shaped. 2.The curve is symmetrical to its center, the mean. 3.The mean, median and mode coincide at the center.
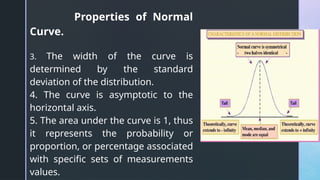
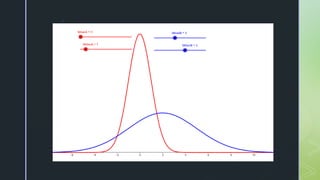
- 14. Properties of Normal Curve. 3. The width of the curve is determined by the standard deviation of the distribution. 4. The curve is asymptotic to the horizontal axis. 5. The area under the curve is 1, thus it represents the probability or proportion, or percentage associated with specific sets of measurements values.
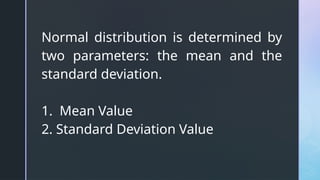
- 15. Normal distribution is determined by two parameters: the mean and the standard deviation. 1. Mean Value 2. Standard Deviation Value
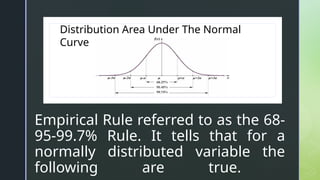
- 16. z z Empirical Rule referred to as the 68- 95-99.7% Rule. It tells that for a normally distributed variable the following are true. Distribution Area Under The Normal Curve
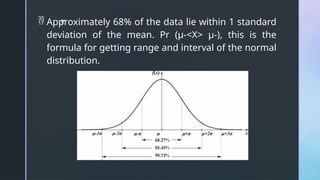
- 17. z ’éĘ Approximately 68% of the data lie within 1 standard deviation of the mean. Pr (╬╝-<X> ╬╝-), this is the formula for getting range and interval of the normal distribution.
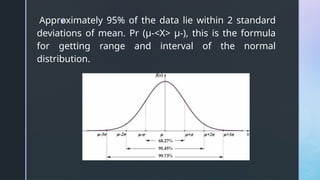
- 18. z Approximately 95% of the data lie within 2 standard deviations of mean. Pr (╬╝-<X> ╬╝-), this is the formula for getting range and interval of the normal distribution.
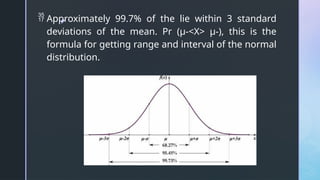
- 19. z ’éĘ Approximately 99.7% of the lie within 3 standard deviations of the mean. Pr (╬╝-<X> ╬╝-), this is the formula for getting range and interval of the normal distribution.
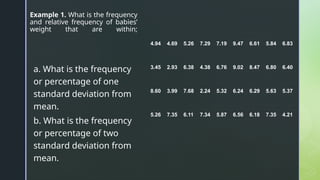
- 20. z z Example 1. What is the frequency and relative frequency of babiesŌĆÖ weight that are within; a. What is the frequency or percentage of one standard deviation from mean. b. What is the frequency or percentage of two standard deviation from mean. 4.94 4.69 5.26 7.29 7.19 9.47 6.61 5.84 6.83 3.45 2.93 6.38 4.38 6.76 9.02 8.47 6.80 6.40 8.60 3.99 7.68 2.24 5.32 6.24 6.29 5.63 5.37 5.26 7.35 6.11 7.34 5.87 6.56 6.18 7.35 4.21
- 21. z
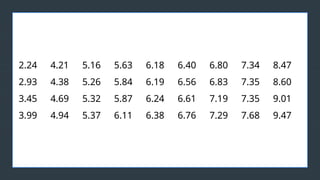
- 22. z 2.24 4.21 5.16 5.63 6.18 6.40 6.80 7.34 8.47 2.93 4.38 5.26 5.84 6.19 6.56 6.83 7.35 8.60 3.45 4.69 5.32 5.87 6.24 6.61 7.19 7.35 9.01 3.99 4.94 5.37 6.11 6.38 6.76 7.29 7.68 9.47
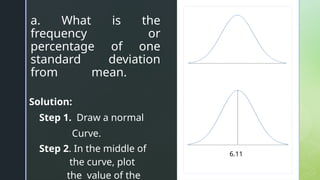
- 23. z z a. What is the frequency or percentage of one standard deviation from mean. Solution: Step 1. Draw a normal Curve. Step 2. In the middle of the curve, plot the value of the 6.11
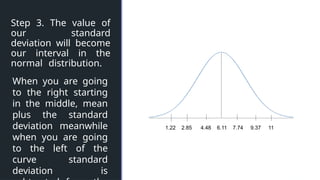
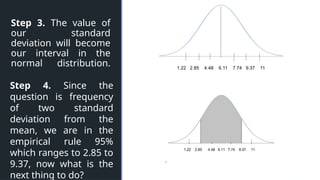
- 24. z z Step 3. The value of our standard deviation will become our interval in the normal distribution. 1.22 2.85 4.48 6.11 7.74 9.37 11 When you are going to the right starting in the middle, mean plus the standard deviation meanwhile when you are going to the left of the curve standard deviation is
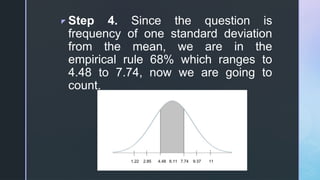
- 25. z Step 4. Since the question is frequency of one standard deviation from the mean, we are in the empirical rule 68% which ranges to 4.48 to 7.74, now we are going to count.
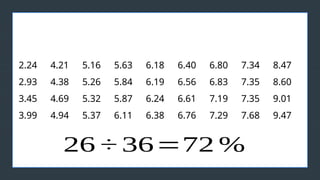
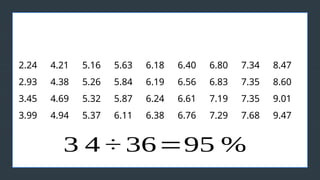
- 26. z 2.24 4.21 5.16 5.63 6.18 6.40 6.80 7.34 8.47 2.93 4.38 5.26 5.84 6.19 6.56 6.83 7.35 8.60 3.45 4.69 5.32 5.87 6.24 6.61 7.19 7.35 9.01 3.99 4.94 5.37 6.11 6.38 6.76 7.29 7.68 9.47 26 ├Ę 36=72 % ├Ę├Ę
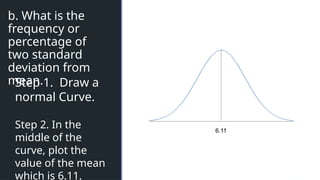
- 27. z z b. What is the frequency or percentage of two standard deviation from mean. 6.11 Step 1. Draw a normal Curve. Step 2. In the middle of the curve, plot the value of the mean which is 6.11.
- 28. z z Step 3. The value of our standard deviation will become our interval in the normal distribution. 1.22 2.85 4.48 6.11 7.74 9.37 11 Step 4. Since the question is frequency of two standard deviation from the mean, we are in the empirical rule 95% which ranges to 2.85 to 9.37, now what is the next thing to do?
- 29. z 2.24 4.21 5.16 5.63 6.18 6.40 6.80 7.34 8.47 2.93 4.38 5.26 5.84 6.19 6.56 6.83 7.35 8.60 3.45 4.69 5.32 5.87 6.24 6.61 7.19 7.35 9.01 3.99 4.94 5.37 6.11 6.38 6.76 7.29 7.68 9.47 3 4 ├Ę 36=95 % ├Ę├Ę
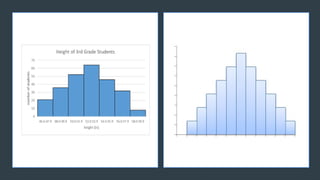
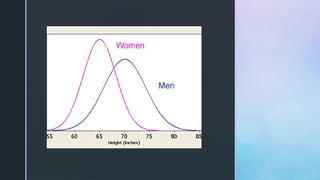
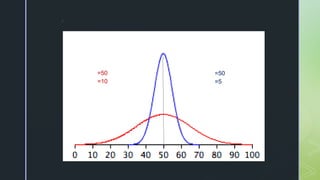
- 30. z How about if we compare two data sets with normal curve?
- 31. z
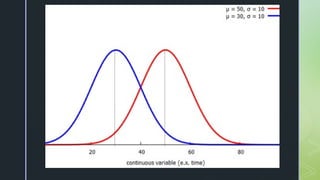
- 32. z =50 =10 =50 =5
- 33. z
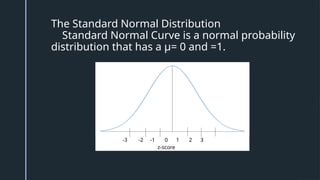
- 34. z z The Standard Normal Distribution Standard Normal Curve is a normal probability distribution that has a ╬╝= 0 and =1. -3 -2 -1 0 1 2 3 z-score
- 35. z The letter Z is used to denote the standard normal random variable. The specific value of the random variable z is called the z-score. The Table of Area Under the Normal Standard Curve is also known as the Z-table. It is where you are going to look for the value of random variable z or
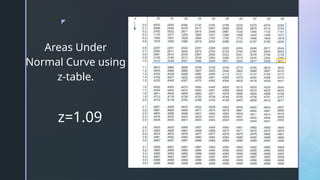
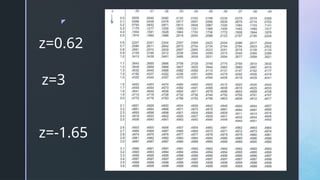
- 36. z Areas Under Normal Curve using z-table. z=1.09
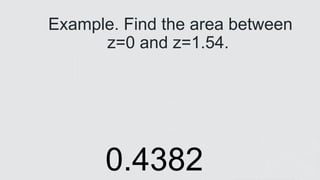
- 38. z z Example. Find the area between z=0 and z=1.54. 0.4382
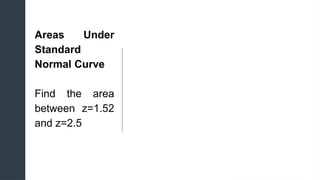
- 39. z z Areas Under Standard Normal Curve Find the area between z=1.52 and z=2.5
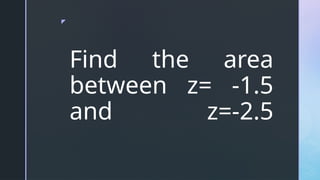
- 40. z Find the area between z= -1.5 and z=-2.5
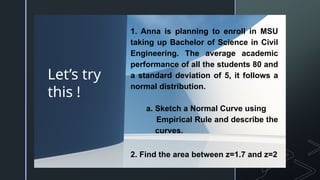
- 41. z LetŌĆÖs try this ! 1. Anna is planning to enroll in MSU taking up Bachelor of Science in Civil Engineering. The average academic performance of all the students 80 and a standard deviation of 5, it follows a normal distribution. a. Sketch a Normal Curve using Empirical Rule and describe the curves. 2. Find the area between z=1.7 and z=2
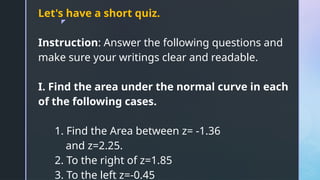
- 42. z Let's have a short quiz. Instruction: Answer the following questions and make sure your writings clear and readable. I. Find the area under the normal curve in each of the following cases. 1. Find the Area between z= -1.36 and z=2.25. 2. To the right of z=1.85 3. To the left z=-0.45
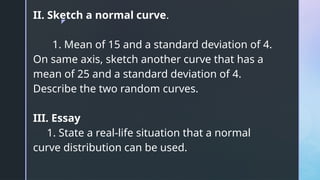
- 43. z II. Sketch a normal curve. 1. Mean of 15 and a standard deviation of 4. On same axis, sketch another curve that has a mean of 25 and a standard deviation of 4. Describe the two random curves. III. Essay 1. State a real-life situation that a normal curve distribution can be used.