1 of 1
Download to read offline
Ad
Recommended
Scientific notation edmodo 2013 14
Scientific notation edmodo 2013 14shumwayc
Ěý
The document discusses scientific notation and how to convert numbers between standard form and scientific notation. It provides the following key points:
1) Scientific notation consists of a number between 1 and 10 multiplied by a power of 10.
2) To convert a number to scientific notation, place the decimal after the first digit to get the coefficient, and the exponent is the number of places the decimal is moved.
3) Positive exponents mean the decimal is moved to the right, negative exponents mean it is moved to the left.
4) Examples are provided of converting numbers between standard and scientific notation.Pythagorean theorem 2012 13 edmodo
Pythagorean theorem 2012 13 edmodoshumwayc
Ěý
The document explains the Pythagorean theorem, which states that in a right triangle, the sum of the squares of the lengths of the two legs is equal to the square of the length of the hypotenuse. It provides examples of using the theorem to find the length of the hypotenuse given the lengths of the two legs. The document also includes examples of drawing squares based on the sides of a right triangle and using the theorem to solve for missing side lengths.More Related Content
What's hot (20)
Viewers also liked (9)
Scientific notation edmodo 2013 14
Scientific notation edmodo 2013 14shumwayc
Ěý
The document discusses scientific notation and how to convert numbers between standard form and scientific notation. It provides the following key points:
1) Scientific notation consists of a number between 1 and 10 multiplied by a power of 10.
2) To convert a number to scientific notation, place the decimal after the first digit to get the coefficient, and the exponent is the number of places the decimal is moved.
3) Positive exponents mean the decimal is moved to the right, negative exponents mean it is moved to the left.
4) Examples are provided of converting numbers between standard and scientific notation.Pythagorean theorem 2012 13 edmodo
Pythagorean theorem 2012 13 edmodoshumwayc
Ěý
The document explains the Pythagorean theorem, which states that in a right triangle, the sum of the squares of the lengths of the two legs is equal to the square of the length of the hypotenuse. It provides examples of using the theorem to find the length of the hypotenuse given the lengths of the two legs. The document also includes examples of drawing squares based on the sides of a right triangle and using the theorem to solve for missing side lengths.Second 9 review edmodo 2013 2014
Second 9 review edmodo 2013 2014shumwayc
Ěý
The first document reviews transformations and identifying the rule of a translation. It provides an example of a transformation 3 units left and 4 units up with the rule (x - 3, y + 4). The second document reviews solving for x in an equation involving angles and using scientific notation to write very small and large numbers. The third document involves finding side lengths and perimeters of squares and cubes, operations with exponents, and solving multi-step equations.Multiply divide scientific notation edmodo 2013 14
Multiply divide scientific notation edmodo 2013 14shumwayc
Ěý
This document provides instructions and examples for performing calculations using scientific notation. It explains how to multiply and divide terms in scientific notation by multiplying or dividing the coefficients and using exponent properties. It then provides examples of multiplying and dividing terms in scientific notation, such as 4 x 10³ • 3 x 104 = 12 x 107, and their simplified forms.pythagoras theorem
pythagoras theoremAjitesh Mahalingam
Ěý
The document explains the Pythagorean theorem, a key property of right-angled triangles stating that the square of the hypotenuse is equal to the sum of the squares of the other two sides. It also provides a brief overview of Pythagoras, a Greek mathematician who is credited with proving this property, and highlights real-life applications such as navigation and measuring heights. Additionally, it mentions Pythagorean triplets, which are sets of three natural numbers that satisfy the theorem.Squares cubes and roots edmodo 2013 14
Squares cubes and roots edmodo 2013 14shumwayc
Ěý
This document covers topics in 8th grade math including squares, cubes, and roots. It discusses:
- Perfect squares and cubes, which are numbers that result from an integer multiplied by itself, such as 4, 9, 16, etc.
- How to find the square root, which is the length of one side of a square, and cube root, which is the length of one side of a cube.
- How to estimate non-perfect squares by finding which two perfect squares a given number falls between.
- Examples of plotting perfect squares and cubes, finding cube roots, and comparing numbers.Functions four representations edmodo 2013 2014
Functions four representations edmodo 2013 2014shumwayc
Ěý
The document discusses patterns in number sequences and linear functions modeling real-world situations. It provides examples of arithmetic, geometric, and Fibonacci sequences. It also shows tables representing the relationship between the number of boxes and toothpicks, with students asked to determine the independent and dependent variables, rate of change, and equation. Finally, it gives examples of using linear functions to model costs that vary with phone data usage, textbook shipping, and taxi mileage.Linear nonlinearfunctionsedmodo 2013-2014
Linear nonlinearfunctionsedmodo 2013-2014shumwayc
Ěý
The document provides examples of common functions including linear, quadratic, cubic, absolute value, square root, and rational functions. It graphs each function using tables or plots to illustrate their shapes. It then discusses whether the area and perimeter functions for squares and cubes are linear or non-linear based on examining their graphs. It also introduces the concept of unit rate of change and provides examples to calculate unit rates from given scenarios about phone plans and plant growth.Ad
More from shumwayc (20)
Intro to exponents edmodo 2013 14
Intro to exponents edmodo 2013 14shumwayc
Ěý
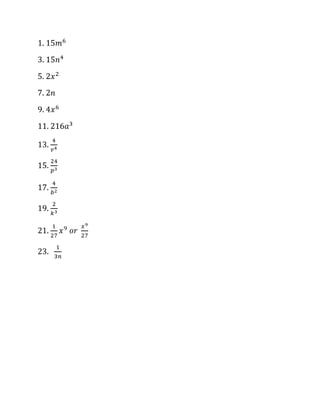
The document discusses exponents and operations involving exponents. It provides examples of evaluating expressions with exponents, such as 52 = 25 and (-5)2 = 25. It also covers the rules for exponents, such as when a term is inside parentheses the entire term is raised to the power, and when outside only the base. Negative exponents are introduced, following the pattern that x-1 = 1/x.Transversals similar figures edmodo
Transversals similar figures edmodoshumwayc
Ěý
The document discusses similar and congruent triangles. It provides the definitions that two figures are similar if they have the same shape, and for triangles to be similar their corresponding angles must be congruent and corresponding sides must be proportional. It then gives examples of finding missing side lengths of triangles using the properties of similar triangles.Transversals edmodo 2013 14
Transversals edmodo 2013 14shumwayc
Ěý
This document contains a math problem solving 3x + x + 20 = 180, instructions to define complementary and supplementary angles, and a diagram showing a set of parallel lines cut by a transversal forming eight angles. Students are asked to identify how many angles were formed by the parallel lines and transversal, and to find the measures of angles 2 through 8.Dilations edmodo 2013 14
Dilations edmodo 2013 14shumwayc
Ěý
This document introduces dilations by defining them as a type of transformation where a figure stretches or shrinks with respect to a fixed point. It explains that dilations use a scale factor, where a scale factor greater than 1 makes the figure larger (stretch) and a scale factor between 0-1 makes the figure smaller (shrink). The document provides examples of how to calculate new dimensions of a figure after dilating it using different scale factors. It also explains that dilations have a center of dilation, so that corresponding vertices of the original and dilated figures lie on the same line from the center. Examples are given to practice dilating shapes using different scale factors with the origin as the center of dilation.Transformations edmodo 2013
Transformations edmodo 2013shumwayc
Ěý
1. The document discusses different types of transformations including translations, reflections, and rotations.
2. A translation slides all points of a figure the same distance in the same direction, preserving congruence. A reflection flips a figure across a line of reflection to create a mirror image, also preserving congruence.
3. Rotations turn all points of a figure about a fixed center point through a given angle, resulting in a congruent figure. Examples are provided of applying transformations to polygons on a coordinate plane.Integer review
Integer reviewshumwayc
Ěý
This document provides an overview of integer operations including addition, subtraction, multiplication, division, and order of operations. It begins with examples of adding and subtracting integers by keeping the same or different signs and combining like terms. Next, it discusses multiplying and dividing integers by keeping the sign positive if the factors have the same sign and negative if they are different. Finally, it introduces the order of operations as parenthesis, exponents, multiplication/division from left to right, and addition/subtraction from left to right, providing examples to solve.Rocket report
Rocket reportshumwayc
Ěý
This document contains instructions for three math problems involving products, as well as guidelines for designing a pop can experiment to produce the most spins and a report outline on a rocket activity. Students are asked to find the products of (2m + 6n)2 and (8x + 4)(5x2 + 5x + 5), design test cans that vary hole size, number and placement, and write a report discussing their original hypothesis, experiment details and results, changes made to the final rocket, and potential future design changes.3rd 9 review answers 1 41
3rd 9 review answers 1 41shumwayc
Ěý
This document provides answers to odd numbered questions 1 through 41 from a 3rd 9-week final review. The answers include positive, yes, zero, depends on coordinates, various answers, comparisons of slopes and rates of change between two liquids, that Malik runs 7 miles per hour, and that the time is 20 minutes.Line best fit 2012-13 edmodo
Line best fit 2012-13 edmodoshumwayc
Ěý
A scatter plot shows the relationship between two sets of data by plotting corresponding x and y values as points on a graph. Scatter plots can reveal whether the two variables have a positive, negative, or no correlation. A positive correlation means that as one variable increases, so does the other. A negative correlation means that as one variable increases, the other decreases. No correlation means the variables do not trend together or against each other. Lines of best fit can approximate positive or negative correlations in a scatter plot.Unit 6 practice 1
Unit 6 practice 1shumwayc
Ěý
The document contains a practice worksheet with multiple linear equation and graphing problems. Some key details:
- Problem 1 asks the student to write an equation showing monthly smartphone plan cost as a function of data used, and to calculate the cost if 6GB of data is used.
- Problem 5 asks the student to write an equation describing tickets sold for a dance based on given prices and total amount raised.
- Problem 14 asks the student to write the standard and slope-intercept forms of an equation modeling how long it will take someone to complete an ultra-marathon by walking and running portions.Unit 6 practice 1 solutions
Unit 6 practice 1 solutionsshumwayc
Ěý
1. Malcolm enters an 80km ultra-marathon race. His walking speed is 8km/h and running speed is 10km/h. Let x=hours walked and y=hours run.
2. The linear equation relating x and y is 8x + 10y = 80.
3. If Malcolm walked the entire race, it would take him 10 hours. If he ran the entire race, it would take 8 hours.
4. If he walks for 6 hours, he will need to run for 3.2 hours to complete the 80km race.x and y intercepts 2012-13 edmodo
x and y intercepts 2012-13 edmodoshumwayc
Ěý
Here are the steps to find the x and y intercepts of the given equations:
1. 3x + 5y = 30
X-intercept: Put 0 in for y. 3x + 5(0) = 30. 3x = 30. x = 10
Y-intercept: Put 0 in for x. 3(0) + 5y = 30. 5y = 30. y = 6
2. 4x + 2y = 12
X-intercept: Put 0 in for y. 4x + 2(0) = 12. 4x = 12. x = 3
Y-intercept: Put 0 in for x. 4(0) + 2y = 12. 2yStandard Form Equations 2012 13 edmodo
Standard Form Equations 2012 13 edmodoshumwayc
Ěý
1) Standard form of a linear equation is Ax + By = C, where A and B are not zero.
2) To graph a line in standard form, you first convert it to slope-intercept form by solving for y and writing the equation as y = mx + b.
3) Six linear equations are given in standard form. To graph them, each must first be converted to slope-intercept form by solving for y before plotting the line on a graph.Finding the slope of a line edmodo
Finding the slope of a line edmodoshumwayc
Ěý
The document discusses slope and linear equations. It defines slope as the ratio of vertical change to horizontal change between two points on a line. Slope is also known as "rise over run". The document provides examples of finding the slope of lines from graphs and equations. It also gives two examples of using linear equations to model real-world scenarios involving cost as a function of an input variable. Finally, it introduces the slope-intercept form of a linear equation as y = mx + b, where m is the slope and b is the y-intercept.Second 9 review edmodo
Second 9 review edmodoshumwayc
Ěý
The document provides a review of various math concepts including:
- Identifying transformations based on pre-image and rule
- Writing expressions in scientific notation
- Simplifying expressions
- Solving equations and inequalities
- Graphing lines and finding slopes
- Calculating volumes, distances, and rates involving spheres, cylinders, cones, cubes, and triangles
- Determining whether relations represent functions
- Modeling real-world scenarios like bicycle costs, lawn cutting earnings, and wheelchair ramp lengths using functions
The review covers a wide range of math topics to prepare students for their next assessment.Slope and triangles edmodo
Slope and triangles edmodoshumwayc
Ěý
Similar triangles have the same shape but not necessarily the same size. The corresponding angles of similar triangles are congruent and their corresponding sides are in proportion. Slope is a property of lines that is the same between any two points on a non-vertical line, and can be found using similar right triangles. Slope is defined as the vertical change over the horizontal change between two points on a line.Linear-Non Linear Functions edmodo
Linear-Non Linear Functions edmodoshumwayc
Ěý
The document discusses different types of functions including linear, quadratic, cubic, absolute value, square root, and rational functions. It provides examples of each function through tables and graphs showing how the y-value changes in relation to the x-value. It then uses examples of area, perimeter, and volume of squares and cubes to determine whether those relationships demonstrate linear functions based on their graphical representations.Writing linear functions edmodo
Writing linear functions edmodoshumwayc
Ěý
The document provides examples of representing linear functions in different ways: numerically through tables, graphically by plotting points, and algebraically through equations. It gives three examples - for cell phone costs, textbook shipping costs, and taxi fares - and has the reader fill out tables, create graphs, and write equations to model each situation as a linear function represented in multiple ways.Dependent-Independent Variables edmodo
Dependent-Independent Variables edmodoshumwayc
Ěý
Independent variables are variables that are intentionally manipulated or controlled in an experiment. Dependent variables are measured in relation to changes in the independent variables. An independent variable is identified as x and represents the input, while a dependent variable is identified as y and represents the output. Some examples of independent variables given are amount of fertilizer, number of minutes of practice, and temperature. The corresponding dependent variables that are measured are crop yield, test scores, and seed sprouting times.Ad