Raphael.js
Download as pptx, pdf5 likes1,805 views

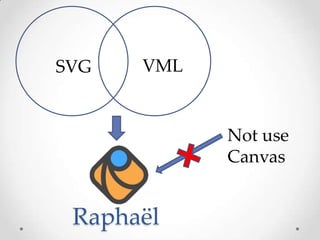
Raphael.js is a JavaScript library for creating vector-based graphics. It allows developers to work with SVG and VML across browsers similarly to how jQuery works with the DOM. Raphael.js provides an API for drawing shapes and setting attributes on a graphical canvas. It supports events, animation, and other features while having a small file size. Raphael.js works across browsers while native SVG, VML, and Canvas have varying browser support. It allows creating scalable and accessible graphics for the web more easily compared to using images.


Raphael.js
- 1. Raphael.Js Mohd Saeed Khan UI Developer Cross Browser Vector Graphics Creating Graphics which never dies, By Using
- 2. RaphaÃŦl v.2.1.0 RaphaÃŦl helps you work with SVG just like jQuery to manipulate the DOM Size:- Minified : 89 KB GZIP : 58 KB
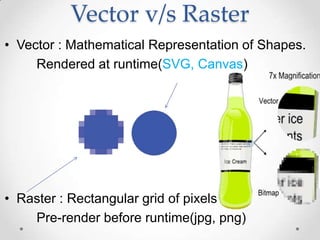
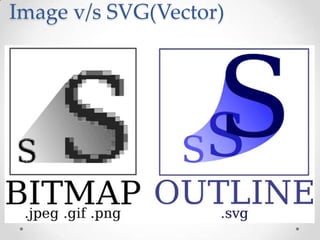
- 3. Vector v/s Raster âĒ Vector : Mathematical Representation of Shapes. Rendered at runtime(SVG, Canvas) âĒ Raster : Rectangular grid of pixels Pre-render before runtime(jpg, png)
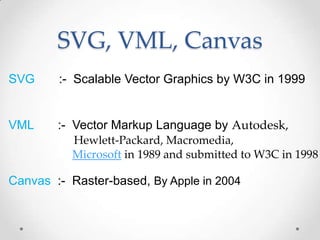
- 6. SVG, VML, Canvas SVG :- Scalable Vector Graphics by W3C in 1999 VML :- Vector Markup Language by Autodesk, Hewlett-Packard, Macromedia, Microsoft in 1989 and submitted to W3C in 1998 Canvas :- Raster-based, By Apple in 2004
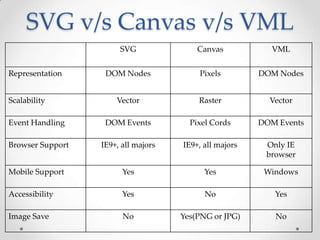
- 8. SVG Canvas VML Representation DOM Nodes Pixels DOM Nodes Scalability Vector Raster Vector Event Handling DOM Events Pixel Cords DOM Events Browser Support IE9+, all majors IE9+, all majors Only IE browser Mobile Support Yes Yes Windows Accessibility Yes No Yes Image Save No Yes(PNG or JPG) No SVG v/s Canvas v/s VML
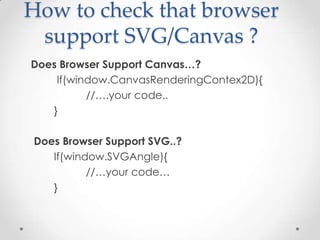
- 10. How to check that browser support SVG/Canvas ? Does Browser Support CanvasâĶ? If(window.CanvasRenderingContex2D){ //âĶ.your code.. } Does Browser Support SVG..? If(window.SVGAngle){ //âĶyour codeâĶ }
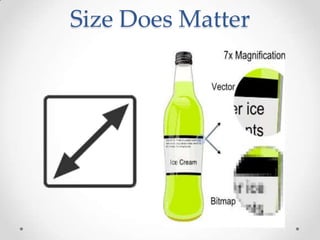
- 11. Size Does Matter
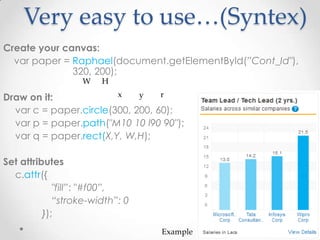
- 12. Very easy to useâĶ(Syntex) Create your canvas: var paper = Raphael(document.getElementById(âCont_Id"), 320, 200); Draw on it: var c = paper.circle(300, 200, 60); var p = paper.path("M10 10 l90 90"); var q = paper.rect(X,Y, W,H); Set attributes c.attr({ "fillâ: "#f00â, âstroke-widthâ: 0 }); Example W H x y r
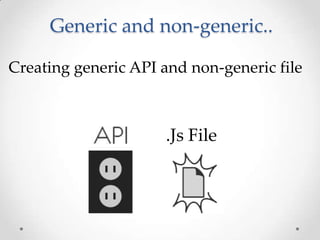
- 14. Generic and non-generic.. Creating generic API and non-generic file .Js File
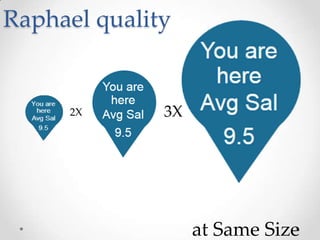
- 15. Raphael quality at Same Size 2X 3X
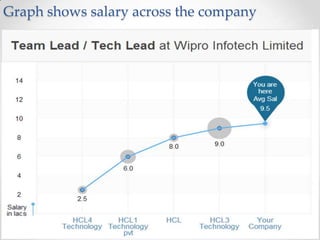
- 16. Graph shows salary across the company
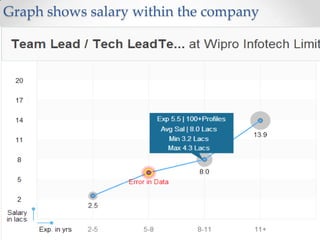
- 17. Graph shows salary within the company
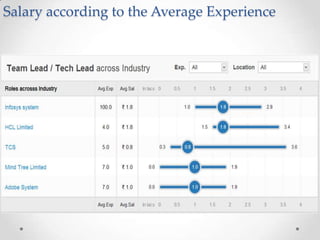
- 18. Salary according to the Average Experience
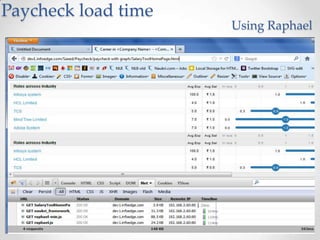
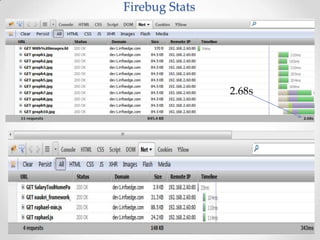
- 19. Paycheck load time Using Raphael
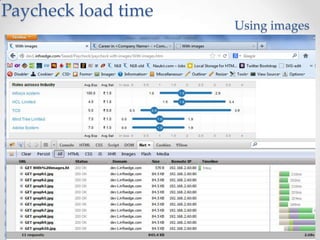
- 20. Paycheck load time Using images
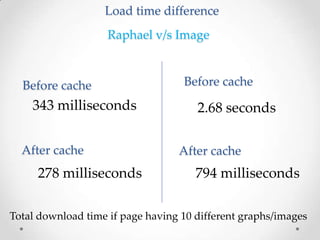
- 22. Load time difference Total download time if page having 10 different graphs/images Before cache Before cache After cache 343 milliseconds 278 milliseconds 794 milliseconds 2.68 seconds After cache Raphael v/s Image
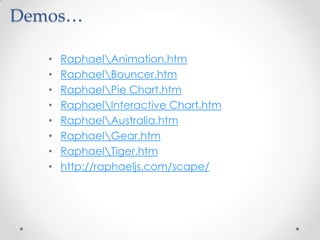
- 23. DemosâĶ âĒ RaphaelAnimation.htm âĒ RaphaelBouncer.htm âĒ RaphaelPie Chart.htm âĒ RaphaelInteractive Chart.htm âĒ RaphaelAustralia.htm âĒ RaphaelGear.htm âĒ RaphaelTiger.htm âĒ http://raphaeljs.com/scape/
Editor's Notes
- #4: Vector images are made of hundreds of thousands of tiny lines and curves (or paths) to create an image Raster images are often called bitmap images because they are made of millions of tiny squares, called pixels. You can identify a raster or bitmap image by looking at it very closely. Example showing effect of vector graphics versus raster graphics. The original vector-based illustration is at the left. The upper-right image illustrates magnification of 7x as a vector graphic. The lower-right illustrates the same magnification as a raster (bitmap) graphic. Raster images are based on pixels and so when scaled there is a loss of clarity, while vector-based graphics can be scaled by any amount without degrading quality.
- #5: How raphel merge SVG and VML? By using javascript merge both technology and make a amzing API which support mostly all the browser..
- #6: Scalable Vector Graphics (SVG) is an XML-based vector image format for two-dimensional graphics that has support for interactivity and animation. The SVG specification is an open standard developed by the World Wide Web Consortium (W3C) since 1999. Vector Markup Language (VML) is an XML-based file format for two-dimensional vector graphics in 1989. Canvas was initially introduced by Apple for use inside their own Mac OS X WebKit component in 2004,[1] powering applications like Dashboard widgets and the Safari browser. Later, in 2005 it was adopted in version 1.8 of Gecko browsers,[2] and Opera in 2006,[3] and standardized by the Web Hypertext Application Technology Working Group (WHATWG) on new proposed specifications for next generation web technologies.[citation needed]
- #7: Scalable Vector Graphics (SVG) is an XML-based vector image format for two-dimensional graphics that has support for interactivity and animation. The SVG specification is an open standard developed by the World Wide Web Consortium (W3C) since 1999. Vector Markup Language (VML) is an XML-based file format for two-dimensional vector graphics in 1989. Canvas was initially introduced by Apple for use inside their own Mac OS X WebKit component in 2004,[1] powering applications like Dashboard widgets and the Safari browser. Later, in 2005 it was adopted in version 1.8 of Gecko browsers,[2] and Opera in 2006,[3] and standardized by the Web Hypertext Application Technology Working Group (WHATWG) on new proposed specifications for next generation web technologies.[citation needed]
- #11: SVGĖýis an earlier standard for drawing shapes in browsers. However, unlike Canvas which isĖýraster-based, SVG isĖývector-based, i.e., each drawn shape is remembered as an object in aĖýscene graphĖýorĖýDocument Object Model, which is subsequently rendered to a bitmap. This means that if attributes of an SVG object are changed, the browser can automatically re-render the scene. In the Canvas example above, once the rectangle is drawn, the fact that it was drawn is forgotten by the system. If its position were to be changed, the entire scene would need to be redrawn, including any objects that might have been covered by the rectangle. But in the equivalent SVG case, one could simply change the position attributes of the rectangle and the browser would determine how to repaint it. There are additional JavaScript libraries that add scene-graph capabilities to the Canvas element. It is also possible to paint a canvas in layers and then recreate specific layers. SVG images are represented inĖýXML, and complex scenes can be created and maintained with XML editing tools. The SVG scene graph enablesĖýevent handlersĖýto be associated with objects, so a rectangle may respond to anĖýonClickĖýevent. To get the same functionality with canvas, one must manually match the coordinates of the mouse click with the coordinates of the drawn rectangle to determine whether it was clicked. Conceptually, canvas is a lower-level API upon which an engine, supporting for example SVG, might be built. There are JavaScript libraries that provide partial SVG implementations using Canvas for browsers that do not provide SVG but support Canvas. However, this is not (normally) the caseâthey are independent standards. The situation is complicated because there are scene graph libraries for Canvas, and SVG has some bitmap manipulation functionality.
- #12: Responsive layoutâĶ