ݺߣ

ݺߣShare a Scribd company logo
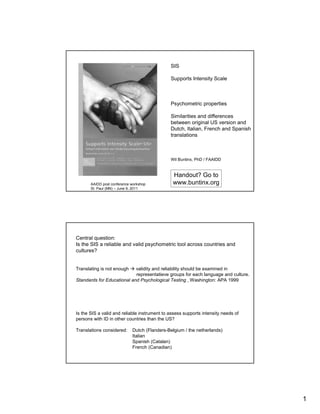
SIS

                                              Supports Intensity Scale


                                              Psychometric properties

                                              Similarities and differences
                                              between original US version and
                                              Dutch, Italian, French and Spanish
                                              translations


                                              Wil Buntinx, PhD / FAAIDD


                                               Handout? Go to
       AAIDD post conference workshop          www.buntinx.org
       St. Paul (MN) – June 9, 2011


Central question:
Is the SIS a reliable and valid psychometric tool across countries and
cultures?


Translating is not enough   validity and reliability should be examined in
                            representatieve groups for each language and culture.
Standards for Educational and Psychological Testing , Washington: APA 1999


Is the SIS a valid and reliable instrument to assess supports intensity needs of
persons with ID in other countries than the US?

Translations considered:     Dutch (Flanders-Belgium / the netherlands)
                             Italian
                             Spanish (Catalan)
                             French (Canadian)


                                                                                    1
SIS relilability
                       Internal consistency (α) – split-half – SEM


                              Dutch Standardization         Flemish standardization       USA 1    Italy     Spain


                 number                          split-                         split-
 SIS subscale    of items
                                   α     SEM                      α     SEM                 α           α      α
                                                  half                           half


 Section 1

     A              8          .95        .7      .97         .93        .8      .90       .95     0.96       .93

     B              8          .96        .6      .96         .95        .7      .91       .95      .97       .97

     C              9          .97        .5      .96         .95        .7      .84       .97      .97       .96

     D              8          .96        .6      .92         .94        .7      .86       .97      .96       .95

     E              8          .95        .7      .94         .92        .8      .86       .94      .95       .93

     F              8          .97        .5      .97         .94        .7      .87       .96      .97       .95

 SIS Index         49          .99        1,5     .98         .98        2,1     .91       .99      .99       .99


                                                SIS reliability
             Test-retest - Inter-interviewer - Inter-respondent - client-staff

                                                                                              Inter-        Client-
                        Test-retest                       Inter-interviewer                                  staff
                                                                                           respondent
                USA 1       Canad      Spain    USA 1     USA 2       Canad    Spain     USA 2    Canad     Dutch
    SIS
  subscale
 section 1
     A           .87         .85        .98      .90        .80        .92      .86       .73      .88       .74
     B           .74         .77        .94      .68        .89        .82      .86       .91      .87       .58
     C           .75         .75        .93      .55        .88        .85      .71       .75      .87       .44
     D           .83         .75        .96      .55        .77        .90      .62       .93      .87       .31
     E           .86         .81        .90      .72        .96        .79      .71       .91      .91       .77
     F           .94         .68        .98      .60        .74        .79      .66       .87      .85       .51
 SIS Index       .82         .84        .94      .59        .88        .91      .80       .87      .82       .80
                  3     3     3                  <1         <1         <1       <1        <1       <1
 Interval       weeks weeks weeks               week       week       week     week      week     week
 N              106          19        143      106         40         39      143         40      72        29

Effect of TRAINING interviewers !                                                      Client – staff respondent
no training versus training                                                            correspondence


                                                                                                                      2
SIS psychometric characteristics
• Reliability summary

      Cronbach α (int. consistency): .99
      (all subscales α > .93)
      Test-retest: .82 - .94
      Inter-respondent: .82 - .87
      Inter-interviewers: [.59] .80 - .91

      Special case: correlation between client
      response and professional staff / parent responses
          when interviewing the client, always use more
       information sources in order to get a reliable estimate of
      intensity of supports need.


       SIS psychometric characteristics

•   Validity

      Content validity

      content validity of translated SIS = similar to original
      (‘universal construct’ of ‘support need’)


      Criterion validity = independent judgment of intensity of needed supports
      On a 5 point Likert scale per domain and full section 1 scale


                                                                                  3
Criterion validity                      correlations between SIS scores and
                                             independent judgment of support need intensity
                                             by direct support staff


                SIS               Independant        Independent     Independent           Concurrent
                section 1            judgment           judgment       Judgment               validity
                subscale                 staff              staff           staff             ELIDA
                                                                                                 scale


                                          USA 1       Dutch pilot         Spanish        Flemish stand.
                                                           study            study                group


                 A                           .66              .79              .74                 .86
                 B                           .51              .73              .71                 .69
                 C                           .46              .81              .48                 .55
                 D                           .59              .76              .68                 .55
                 E                           .53              .81              .69                 .69
                 F                           .62              .75              .69                 .58
                SIS Index                    .62              .83              .75                 .74
                N                            106             101              352                4,211


       Construct validity                                   Subscale intercorrelations

SIS
Section 1   A               B                  C                 D                   E                    F


A


B           .84/.84/.50


C           .57/.77/.43     .66/.85/.45


D           .59/.73/.30     .62/.77/.34       .85/.82/.54


E           .86/.85/.56     .84/.86/.52       .70/.85/.40       .71/.79/.48


F           .70/.76/.46     .77/.85/.51       .77/.84/.51       .77/.82/.46       .82/.85/.51

SIS Index   .86/.90/.60     .89/.94/.59       .86/.93/.62       .86/.89/.59       .93/.94/.62         .91/.93/.59


                                          Dutch / Flemish study / American original study


                                                                                                                    4
Construct validity                                        Correlation SIS – VABS / ICAP


                      SIS                     VABS total       VABS total        ICAP
                      section 1                   score            score         Score

                                                  USA 1            NL/VL         Spain


                      A                             -.61             -.84         -.71
                      B                             -.57             -.76         -.72
                      C                             -.45             -.41         -.42
                      D                             -.48             -.42         -.61
                      E                             -.52             -.81         -.69
                      F                             -.49             -.65         -.69
                      SIS Index                     -.59             -.77         -.73
                      N                             178               75          352


VABS: Vineland Adaptive Behavior Scale
ICAP: Inventory for Client and Agency Planning


       Construct validity


         Correlations between SIS Section 1 subscales and age & gender (Spain)

                                                    SUBSCALES

                                                                                   Health
                      Home          Community         Lifelong                                Social
                                                                    Employment      And
                      living          living          learning                               activities
                                                                                   safety
     AGE              0.08             0.08            0.05            0.10         0.16         0.07
     GENDER           -0.06            0.00            -0.06           -0.06        0.01         -0.03


     Correlations between SIS Section 1 subscales and gender in Dutch version is
                                   .00 (N=4,211)


                                                                                                          5
Construct validity
                                     Distribution of SIS Index scores
                                     In 4.211 individuals with ID Dutch – Flemish standardization


                             12.00


                                                                                                    Group mean
                 SIS Index
                             10.00


                              8.00


                              6.00


                                        mild        moderate severe         profound

                                           Level of Intellectual Functioning


    Are traditional ‘levels of functioning’ a good indicator of support needs ????


   Factor validity


Spanish and Dutch factor analysis studies confirm 6 factor structure
of section 1


Exploratory factor analysis in Section 1 also shows
a solide 6 factor structure that corresponds with subscales A-F


Extra finding: when section 2 is included in the factor analysis
a 7 factor SIS is a also reliably demonstrated!


Extra finding: in resource allocation tasks, a short form of the SIS (22 items)
showed to be valid, reliable and useful

(Bossaert et al., 2009; Kuppens et al., 2010; also                              Gomiero et al. 2011)


                                                                                                                 6
Conclusions

The SIS fully maintains its (very) high internal consistency throughout all
translations.

Inter-interviewer / inter-respondent correspondences are ‘good’.

Construct validity = OK! / subscale intercorrelations are higher in translated
                    versions (i.e. Dutch & Spanish studies) as compared to US.

Small differences in averages and SD of SIS raw scores related to
standardization sample characteristics?   difficult to tell... A special
international study would be welcome to see how these differences can be
explained.

So far, no independent (re)constructions of SIS in other cultures have been
made. However, some test accreditation councils do stress this appraoch.

A short form of SIS is likely to maintain all psychometric properties of full scale.


            Wil H.E. Buntinx
            Maastricht University
            The Netherlands


            Contact: w.buntinx@maastrichtuniversity.nl


            For international SIS basic training and SIS train-the-trainer courses,
            see: www.buntinx.org


                                                                                       7

More Related Content

SIS (©) psychometric properties AAIDD congress St.Paul (MN) june 9, 2011

  • 1. SIS Supports Intensity Scale Psychometric properties Similarities and differences between original US version and Dutch, Italian, French and Spanish translations Wil Buntinx, PhD / FAAIDD Handout? Go to AAIDD post conference workshop www.buntinx.org St. Paul (MN) – June 9, 2011 Central question: Is the SIS a reliable and valid psychometric tool across countries and cultures? Translating is not enough validity and reliability should be examined in representatieve groups for each language and culture. Standards for Educational and Psychological Testing , Washington: APA 1999 Is the SIS a valid and reliable instrument to assess supports intensity needs of persons with ID in other countries than the US? Translations considered: Dutch (Flanders-Belgium / the netherlands) Italian Spanish (Catalan) French (Canadian) 1
  • 2. SIS relilability Internal consistency (α) – split-half – SEM Dutch Standardization Flemish standardization USA 1 Italy Spain number split- split- SIS subscale of items α SEM α SEM α α α half half Section 1 A 8 .95 .7 .97 .93 .8 .90 .95 0.96 .93 B 8 .96 .6 .96 .95 .7 .91 .95 .97 .97 C 9 .97 .5 .96 .95 .7 .84 .97 .97 .96 D 8 .96 .6 .92 .94 .7 .86 .97 .96 .95 E 8 .95 .7 .94 .92 .8 .86 .94 .95 .93 F 8 .97 .5 .97 .94 .7 .87 .96 .97 .95 SIS Index 49 .99 1,5 .98 .98 2,1 .91 .99 .99 .99 SIS reliability Test-retest - Inter-interviewer - Inter-respondent - client-staff Inter- Client- Test-retest Inter-interviewer staff respondent USA 1 Canad Spain USA 1 USA 2 Canad Spain USA 2 Canad Dutch SIS subscale section 1 A .87 .85 .98 .90 .80 .92 .86 .73 .88 .74 B .74 .77 .94 .68 .89 .82 .86 .91 .87 .58 C .75 .75 .93 .55 .88 .85 .71 .75 .87 .44 D .83 .75 .96 .55 .77 .90 .62 .93 .87 .31 E .86 .81 .90 .72 .96 .79 .71 .91 .91 .77 F .94 .68 .98 .60 .74 .79 .66 .87 .85 .51 SIS Index .82 .84 .94 .59 .88 .91 .80 .87 .82 .80 3 3 3 <1 <1 <1 <1 <1 <1 Interval weeks weeks weeks week week week week week week N 106 19 143 106 40 39 143 40 72 29 Effect of TRAINING interviewers ! Client – staff respondent no training versus training correspondence 2
  • 3. SIS psychometric characteristics • Reliability summary Cronbach α (int. consistency): .99 (all subscales α > .93) Test-retest: .82 - .94 Inter-respondent: .82 - .87 Inter-interviewers: [.59] .80 - .91 Special case: correlation between client response and professional staff / parent responses when interviewing the client, always use more information sources in order to get a reliable estimate of intensity of supports need. SIS psychometric characteristics • Validity Content validity content validity of translated SIS = similar to original (‘universal construct’ of ‘support need’) Criterion validity = independent judgment of intensity of needed supports On a 5 point Likert scale per domain and full section 1 scale 3
  • 4. Criterion validity correlations between SIS scores and independent judgment of support need intensity by direct support staff SIS Independant Independent Independent Concurrent section 1 judgment judgment Judgment validity subscale staff staff staff ELIDA scale USA 1 Dutch pilot Spanish Flemish stand. study study group A .66 .79 .74 .86 B .51 .73 .71 .69 C .46 .81 .48 .55 D .59 .76 .68 .55 E .53 .81 .69 .69 F .62 .75 .69 .58 SIS Index .62 .83 .75 .74 N 106 101 352 4,211 Construct validity Subscale intercorrelations SIS Section 1 A B C D E F A B .84/.84/.50 C .57/.77/.43 .66/.85/.45 D .59/.73/.30 .62/.77/.34 .85/.82/.54 E .86/.85/.56 .84/.86/.52 .70/.85/.40 .71/.79/.48 F .70/.76/.46 .77/.85/.51 .77/.84/.51 .77/.82/.46 .82/.85/.51 SIS Index .86/.90/.60 .89/.94/.59 .86/.93/.62 .86/.89/.59 .93/.94/.62 .91/.93/.59 Dutch / Flemish study / American original study 4
  • 5. Construct validity Correlation SIS – VABS / ICAP SIS VABS total VABS total ICAP section 1 score score Score USA 1 NL/VL Spain A -.61 -.84 -.71 B -.57 -.76 -.72 C -.45 -.41 -.42 D -.48 -.42 -.61 E -.52 -.81 -.69 F -.49 -.65 -.69 SIS Index -.59 -.77 -.73 N 178 75 352 VABS: Vineland Adaptive Behavior Scale ICAP: Inventory for Client and Agency Planning Construct validity Correlations between SIS Section 1 subscales and age & gender (Spain) SUBSCALES Health Home Community Lifelong Social Employment And living living learning activities safety AGE 0.08 0.08 0.05 0.10 0.16 0.07 GENDER -0.06 0.00 -0.06 -0.06 0.01 -0.03 Correlations between SIS Section 1 subscales and gender in Dutch version is .00 (N=4,211) 5
  • 6. Construct validity Distribution of SIS Index scores In 4.211 individuals with ID Dutch – Flemish standardization 12.00 Group mean SIS Index 10.00 8.00 6.00 mild moderate severe profound Level of Intellectual Functioning Are traditional ‘levels of functioning’ a good indicator of support needs ???? Factor validity Spanish and Dutch factor analysis studies confirm 6 factor structure of section 1 Exploratory factor analysis in Section 1 also shows a solide 6 factor structure that corresponds with subscales A-F Extra finding: when section 2 is included in the factor analysis a 7 factor SIS is a also reliably demonstrated! Extra finding: in resource allocation tasks, a short form of the SIS (22 items) showed to be valid, reliable and useful (Bossaert et al., 2009; Kuppens et al., 2010; also Gomiero et al. 2011) 6
  • 7. Conclusions The SIS fully maintains its (very) high internal consistency throughout all translations. Inter-interviewer / inter-respondent correspondences are ‘good’. Construct validity = OK! / subscale intercorrelations are higher in translated versions (i.e. Dutch & Spanish studies) as compared to US. Small differences in averages and SD of SIS raw scores related to standardization sample characteristics? difficult to tell... A special international study would be welcome to see how these differences can be explained. So far, no independent (re)constructions of SIS in other cultures have been made. However, some test accreditation councils do stress this appraoch. A short form of SIS is likely to maintain all psychometric properties of full scale. Wil H.E. Buntinx Maastricht University The Netherlands Contact: w.buntinx@maastrichtuniversity.nl For international SIS basic training and SIS train-the-trainer courses, see: www.buntinx.org 7