±«²Ō¾±³Ł²ā¤Ē¤Ä¤Æ¤ė¤Ļ¤ø¤į¤Ę¤Ī±Ź°æ±·³Ņ
5 likes5,623 views

2012/9/15¤Ėé_“ߤµ¤ģ¤æ”ø„ф󄥤Ī»į ¤½¤ĪĘß”¹¤Ē¤Ī„ׄģ„¼„óŁYĮĻ¤Ē¤¹”£


![¤µ¤é¤Ėѧ¤Ó¤æ¤¤·½¤Ų
? ¤Ļ¤ø¤į¤Ę¤Ī Unity ? Developer [UNITY]
http://japan.unity3d.com/developer/document/tutorial/my-?rst-unity/
? [ų¼®] UnityČėéT
? Unity„ę©`„¶©`Öś¤±ŗĻ¤¤Ėł
https://www.facebook.com/groups/unityuserj/?bookmark_t=group
28](https://image.slidesharecdn.com/unitypong-120914183139-phpapp01/85/Unity-PONG-28-320.jpg)


More Related Content
What's hot (20)
Similar to ±«²Ō¾±³Ł²ā¤Ē¤Ä¤Æ¤ė¤Ļ¤ø¤į¤Ę¤Ī±Ź°æ±·³Ņ (20)


![[141004] cedec 2014 ??? & ?? ?? #1](https://cdn.slidesharecdn.com/ss_thumbnails/141004cedec20141-141004002523-conversion-gate01-thumbnail.jpg?width=560&fit=bounds)


More from Kohei Kadowaki (16)


Recently uploaded (6)


±«²Ō¾±³Ł²ā¤Ē¤Ä¤Æ¤ė¤Ļ¤ø¤į¤Ę¤Ī±Ź°æ±·³Ņ
- 2. ×Ō¼ŗ½B½é ? ĆūĒ°£ŗéTĆ| ŗćĘ½ (28) @kadoppe ? ĀI£ŗ„Ø„ó„ø„Ė„¢ Rails, (Java?Co?ee)Script, Objective-C ? ¼ēų¤£ŗ HTML5-West.jp„³„¢„į„ó„Š©`/ShareWis Inc. CTO ? ȤĪ¶£ŗ„Ż„Ć„É„„ć„¹„Č/ UstÅäŠÅ 2
- 3. ±¾ČÕ¤ĪŁYĮĻ ? „ׄģ„¼„󄹄鄤„É ? ŗŻŗŻß£Share: http://www.slideshare.net/kadoppe ? „ׄķ„ø„§„Æ„Č ? http://kadoppe.com/downloads/pong.zip 3
- 5. 5
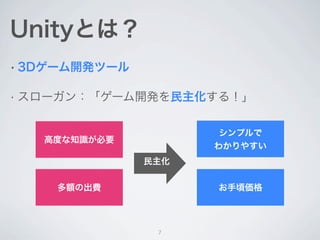
- 6. Unity¤Č¤Ļ£æ ? 3D„²©`„ąé_°k„Ä©`„ė ? „¹„ķ©`„¬„ó£ŗ”ø„²©`„ąé_°k¤ņĆńÖ÷»Æ¤¹¤ė£””¹ „·„ó„ׄė¤Ē ø߶ȤŹÖŖ×R¤¬±ŲŅŖ ¤ļ¤«¤ź¤ä¤¹¤¤ ĆńÖ÷»Æ ¶ąī~¤Ī³öŁM ¤ŖŹÖķżøń 6
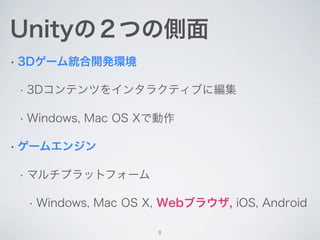
- 7. Unity¤Ī£²¤Ä¤ĪČĆę ? 3D„²©`„ą½yŗĻé_°kh¾³ ? 3D„³„ó„Ę„ó„Ĥņ„¤„ó„æ„é„Æ„Ę„£„Ö¤Ė¾¼Æ ? Windows, Mac OS X¤ĒÓ×÷ ? „²©`„ą„Ø„ó„ø„ó ? „Ž„ė„Į„ׄé„Ć„Č„Õ„©©`„ą ? Windows, Mac OS X, Web„ք鄦„¶, iOS, Android 7
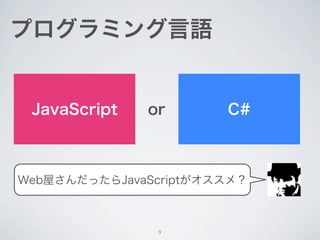
- 8. „ׄķ„°„é„ß„ó„°ŃŌÕZ JavaScript or C# WebĪŻ¤µ¤ó¤Ą¤Ć¤æ¤éJavaScript¤¬„Ŗ„¹„¹„į£æ 8
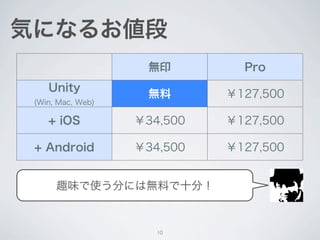
- 9. Ż¤Ė¤Ź¤ė¤Ŗ¶Ī oÓ” Pro Unity oĮĻ £¤127,500 (Win, Mac, Web) + iOS £¤34,500 £¤127,500 + Android £¤34,500 £¤127,500 ȤĪ¶¤ĒŹ¹¤¦·Ö¤Ė¤ĻoĮĻ¤ĒŹ®·Ö£” 9
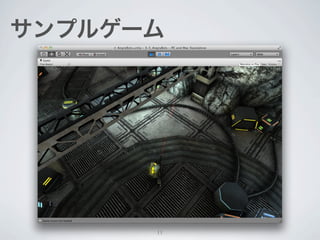
- 10. „µ„ó„ׄė„²©`„ą 10
- 12. „鄤„Ö„³©`„Ē„£„ó„° ¤Č¤¤¤Ć¤Ę¤ā„³©`„Ē„£„ó„°¤ĻÉŁ¤Ź¤¤¤Ē¤¹ 12
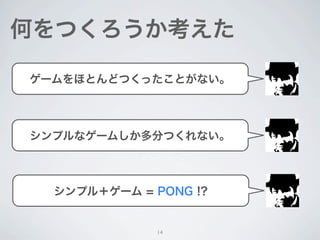
- 13. ŗĪ¤ņ¤Ä¤Æ¤ķ¤¦¤«æ¼¤Ø¤æ „²©`„ą¤ņ¤Ū¤Č¤ó¤É¤Ä¤Æ¤Ć¤æ¤³¤Č¤¬¤Ź¤¤”£ „·„ó„ׄė¤Ź„²©`„ą¤·¤«¶ą·Ö¤Ä¤Æ¤ģ¤Ź¤¤”£ „·„ó„ׄė£«„²©`„ą = PONG !? 13
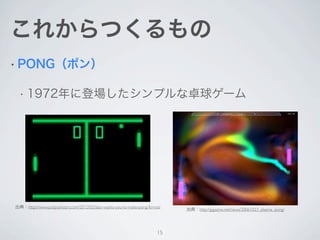
- 14. ¤³¤ģ¤«¤é¤Ä¤Æ¤ė¤ā¤Ī ? PONG£Ø„Ż„ó£© ? 1972Äź¤ĖµĒö¤·¤æ„·„ó„ׄė¤Ź×æĒņ„²©`„ą ³öµä£ŗhttp://www.justpushstart.com/2012/02/atari-wants-you-to-make-pong-for-ios/ ³öµä£ŗhttp://gigazine.net/news/20061023_plasma_pong/ 14
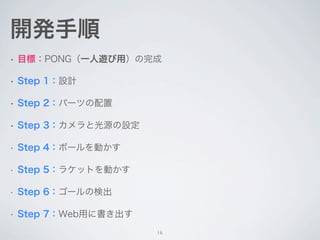
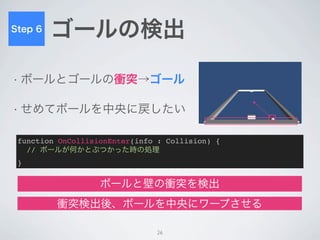
- 15. é_°kŹÖķ ? ÄæĖ£ŗPONG£ØŅ»ČĖß[¤ÓÓĆ£©¤ĪĶź³É ? Step 1£ŗŌOÓ ? Step 2£ŗ„Ń©`„ĤĪÅäÖĆ ? Step 3£ŗ„«„į„é¤Č¹āŌ“¤ĪŌO¶Ø ? Step 4£ŗ„Ü©`„ė¤ņÓ¤«¤¹ ? Step 5£ŗ„鄱„ƄȤņÓ¤«¤¹ ? Step 6£ŗ„“©`„ė¤ĪŹ³ö ? Step 7£ŗWebÓƤĖų¤³ö¤¹ 15
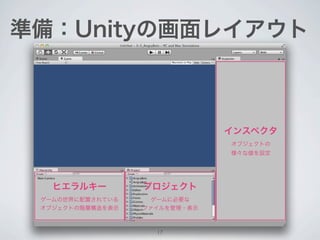
- 16. Ź±ø£ŗ±«²Ō¾±³Ł²ā¤Ī»Ćę„ģ„¤„¢„¦„Č „¤„󄹄Ś„Æ„æ „Ŗ„Ö„ø„§„Æ„Č¤Ī ”©¤Ź¤ņŌO¶Ø „Ņ„Ø„é„ė„©` „ׄķ„ø„§„Æ„Č „²©`„ą¤ĪŹĄ½ē¤ĖÅäÖƤµ¤ģ¤Ę¤¤¤ė „²©`„ą¤Ė±ŲŅŖ¤Ź „Ŗ„Ö„ø„§„Æ„Č¤ĪėAÓŌģ¤ņ±ķŹ¾ „Õ„”„¤„ė¤ņ¹ÜĄķ?±ķŹ¾ 16
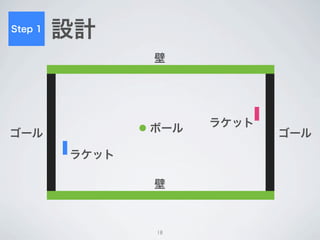
- 17. Step 1 ŌOÓ ±Ś „Ü©`„ė „鄱„Ć„Č „“©`„ė „“©`„ė „鄱„Ć„Č ±Ś 17
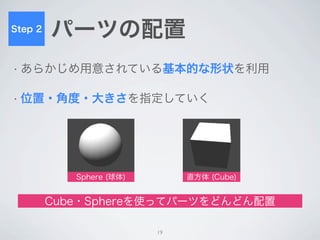
- 18. Step 2 „Ń©`„ĤĪÅäÖĆ ? ¤¢¤é¤«¤ø¤įÓĆŅā¤µ¤ģ¤Ę¤¤¤ė»ł±¾µÄ¤ŹŠĪד¤ņĄūÓĆ ? Ī»ÖĆ?½Ē¶Č?“󤤵¤ņÖø¶Ø¤·¤Ę¤¤¤Æ Sphere (ĒņĢå) Ö±·½Ģå (Cube) Cube?Sphere¤ņŹ¹¤Ć¤Ę„Ń©`„Ĥņ¤É¤ó¤É¤óÅäÖĆ 18
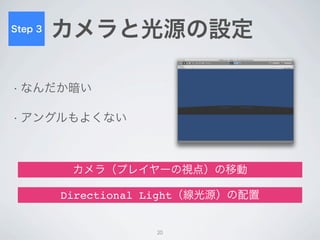
- 19. Step 3 „«„į„é¤Č¹āŌ“¤ĪŌO¶Ø ? ¤Ź¤ó¤Ą¤«°µ¤¤ ? „¢„ó„°„ė¤ā¤č¤Æ¤Ź¤¤ „«„į„é£Ø„ׄģ„¤„ä©`¤ĪŅµć£©¤ĪŅĘÓ Directional Light£Ø¾¹āŌ“£©¤ĪÅäÖĆ 19
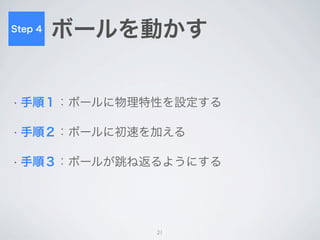
- 20. Step 4 „Ü©`„ė¤ņÓ¤«¤¹ ? ŹÖķ£±£ŗ„Ü©`„ė¤ĖĪļĄķĢŲŠŌ¤ņŌO¶Ø¤¹¤ė ? ŹÖķ£²£ŗ„Ü©`„ė¤Ė³õĖŁ¤ņ¼Ó¤Ø¤ė ? ŹÖķ£³£ŗ„Ü©`„ė¤¬Ģų¤Ķ·µ¤ė¤č¤¦¤Ė¤¹¤ė 20
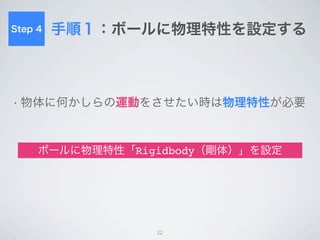
- 21. Step 4 ŹÖķ£±£ŗ„Ü©`„ė¤ĖĪļĄķĢŲŠŌ¤ņŌO¶Ø¤¹¤ė ? ĪļĢå¤ĖŗĪ¤«¤·¤é¤Īß\Ó¤ņ¤µ¤»¤æ¤¤r¤ĻĪļĄķĢŲŠŌ¤¬±ŲŅŖ „Ü©`„ė¤ĖĪļĄķĢŲŠŌ”øRigidbody£ØĢ壩”¹¤ņŌO¶Ø 21
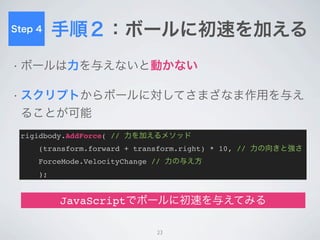
- 22. Step 4 ŹÖķ£²£ŗ„Ü©`„ė¤Ė³õĖŁ¤ņ¼Ó¤Ø¤ė ? „Ü©`„ė¤ĻĮ¦¤ņÓė¤Ø¤Ź¤¤¤ČÓ¤«¤Ź¤¤ ? „¹„Æ„ź„ׄȤ«¤é„Ü©`„ė¤Ė¤·¤Ę¤µ¤Ž¤¶¤Ź¤Ž×÷ÓƤņÓė¤Ø ¤ė¤³¤Č¤¬æÉÄÜ rigidbody.AddForce( // Į¦¤ņ¼Ó¤Ø¤ė„į„½„Ć„É (transform.forward + transform.right) * 10, // Į¦¤ĪĻņ¤¤Č¤µ ForceMode.VelocityChange // Į¦¤ĪÓė¤Ø·½ ); JavaScript¤Ē„Ü©`„ė¤Ė³õĖŁ¤ņÓė¤Ø¤Ę¤ß¤ė 22
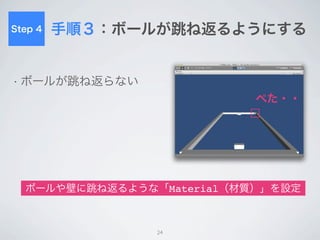
- 23. Step 4 ŹÖķ£³£ŗ„Ü©`„ė¤¬Ģų¤Ķ·µ¤ė¤č¤¦¤Ė¤¹¤ė ? „Ü©`„ė¤¬Ģų¤Ķ·µ¤é¤Ź¤¤ ¤Ś¤æ?? „Ü©`„ė¤ä±Ś¤ĖĢų¤Ķ·µ¤ė¤č¤¦¤Ź”øMaterial£Ø²ÄŁ|£©”¹¤ņŌO¶Ø 23
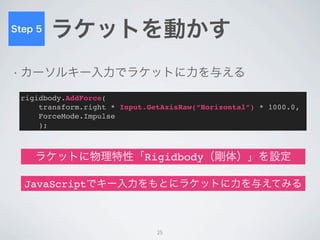
- 24. Step 5 „鄱„ƄȤņÓ¤«¤¹ ? „«©`„½„ė„©`ČėĮ¦¤Ē„鄱„ƄȤĖĮ¦¤ņÓė¤Ø¤ė rigidbody.AddForce( transform.right * Input.GetAxisRaw(”°Horizontal”±) * 1000.0, ForceMode.Impulse ); „鄱„ƄȤĖĪļĄķĢŲŠŌ”øRigidbody£ØĢ壩”¹¤ņŌO¶Ø JavaScript¤Ē„©`ČėĮ¦¤ņ¤ā¤Č¤Ė„鄱„ƄȤĖĮ¦¤ņÓė¤Ø¤Ę¤ß¤ė 24
- 25. Step 6 „“©`„ė¤ĪŹ³ö ? „Ü©`„ė¤Č„“©`„ė¤ĪŠnĶ»”ś„“©`„ė ? ¤»¤į¤Ę„Ü©`„ė¤ņÖŠŃė¤Ėų¤·¤æ¤¤ function OnCollisionEnter(info : Collision) { // „Ü©`„ė¤¬ŗĪ¤«¤Č¤Ö¤Ä¤«¤Ć¤ær¤ĪIĄķ } „Ü©`„ė¤Č±Ś¤ĪŠnĶ»¤ņŹ³ö ŠnĶ»Ź³öįį”¢„Ü©`„ė¤ņÖŠŃė¤Ė„ļ©`„פµ¤»¤ė 25
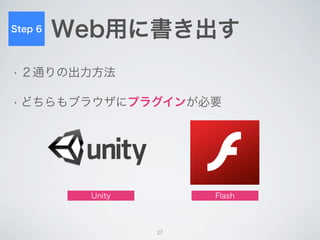
- 26. Step 6 WebÓƤĖų¤³ö¤¹ ? £²Ķؤź¤Ī³öĮ¦·½·Ø ? ¤É¤Į¤é¤ā„ք鄦„¶¤Ė„ׄ鄰„¤„󤬱ŲŅŖ Unity Flash 26
- 27. Ķź³É£” °µ¤Æ?Ņ¤Å¤é¤¤ Ņ¤ä¤¹¤¤?Ó¤Æ „ք鄦„¶¤Ē£” 27
- 28. ¤µ¤é¤Ėѧ¤Ó¤æ¤¤·½¤Ų ? ¤Ļ¤ø¤į¤Ę¤Ī Unity ? Developer [UNITY] http://japan.unity3d.com/developer/document/tutorial/my-?rst-unity/ ? [ų¼®] UnityČėéT ? Unity„ę©`„¶©`Öś¤±ŗĻ¤¤Ėł https://www.facebook.com/groups/unityuserj/?bookmark_t=group 28
- 29. ¤Ž¤Č¤į ? 3D„²©`„ąé_°k„Ä©`„ė”øUnity”¹ ? Ź¹¤¤¤ä¤¹¤¤3D„³„ó„Ę„ó„Ä„Ø„Ē„£„æ ? „Ž„ė„Į„ׄé„Ć„Č„Õ„©©`„ą ? PONG£Ø¤Ī¤č¤¦¤Ź¤ā¤Ī£©¤ņgėH¤Ė¤Ä¤Æ¤Ć¤Ę¤ß¤æ 29