Web Vector Graphics
- 1. ? SitePen, Inc. All Rights Reserved A Journey Through Web Vector Graphics Dylan Schiemann (@dylans) SitePen, Inc. London Ajax, October 12, 2010 Saturday, October 16, 2010
- 2. ? SitePen, Inc. All Rights Reserved ajax bsd ceo comet cometdaily conferences cynic dojodylan@dylans hiring javascript open source schiemann sitepentoolkit travel web www dylan Saturday, October 16, 2010
- 3. ? SitePen, Inc. All Rights Reserved Saturday, October 16, 2010
- 4. ? SitePen, Inc. All Rights Reserved Saturday, October 16, 2010
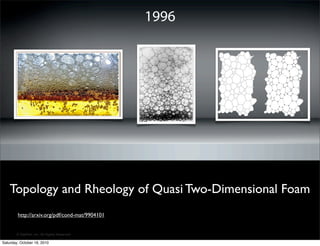
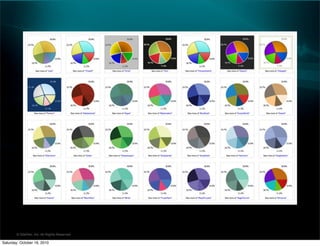
- 5. ? SitePen, Inc. All Rights Reserved Topology and Rheology of Quasi Two-Dimensional Foam 1996 http://arxiv.org/pdf/cond-mat/9904101 Saturday, October 16, 2010
- 6. ? SitePen, Inc. All Rights Reserved Netscape 2-4: JavaScript, but no drawing I didn't like Java or Flash 1996-1999 Saturday, October 16, 2010
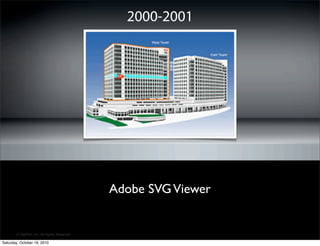
- 7. ? SitePen, Inc. All Rights Reserved Adobe SVGViewer 2000-2001 Saturday, October 16, 2010
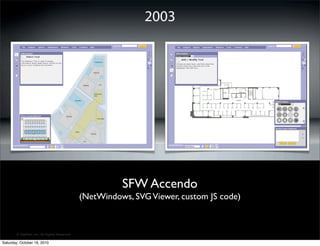
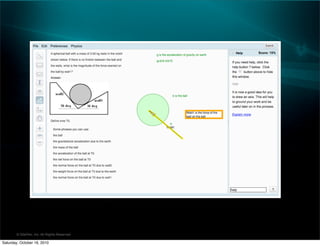
- 8. ? SitePen, Inc. All Rights Reserved SFW Accendo (NetWindows, SVGViewer, custom JS code) 2003 Saturday, October 16, 2010
- 9. ? SitePen, Inc. All Rights Reserved 2004 SVG Viewer dead, except in Adobe Acrobat Adobe acquired an obscure vector graphics format Preventing the death of SVG http://dylanschiemann.com/2004/09/12/preventing-the-death- of-svg/ Dojo Toolkit development started Saturday, October 16, 2010
- 10. ? SitePen, Inc. All Rights Reserved 2005 Dojo 0.1 and 0.2 SVG Viewer Not ideal Mozilla SVG through special builds "One of the very ?rst design decisions of which I was a proponent was that the Dojo Toolkit not be HTML-centric. After working on several SVG-based intranet applications, I was highly motivated to see Dojo work well with SVG and other namespaces that could become relevant in the future." Saturday, October 16, 2010
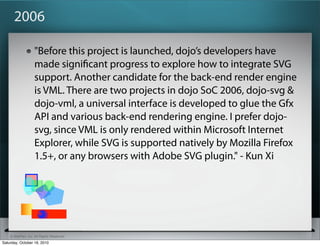
- 11. ? SitePen, Inc. All Rights Reserved 2006 "Before this project is launched, dojoˇŻs developers have made signi?cant progress to explore how to integrate SVG support. Another candidate for the back-end render engine is VML. There are two projects in dojo SoC 2006, dojo-svg & dojo-vml, a universal interface is developed to glue the Gfx API and various back-end rendering engine. I prefer dojo- svg, since VML is only rendered within Microsoft Internet Explorer, while SVG is supported natively by Mozilla Firefox 1.5+, or any browsers with Adobe SVG plugin." - Kun Xi Saturday, October 16, 2010
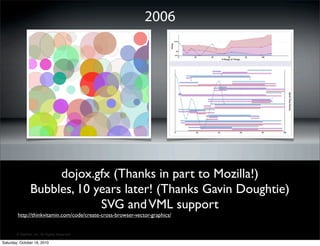
- 12. ? SitePen, Inc. All Rights Reserved dojox.gfx (Thanks in part to Mozilla!) Bubbles, 10 years later! (Thanks Gavin Doughtie) SVG andVML support http://thinkvitamin.com/code/create-cross-browser-vector-graphics/ 2006 Saturday, October 16, 2010
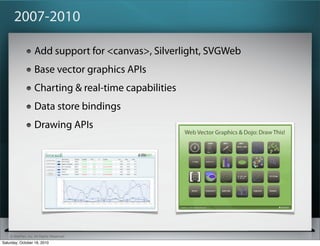
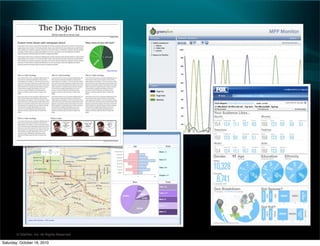
- 13. ? SitePen, Inc. All Rights Reserved 2007-2010 Add support for <canvas>, Silverlight, SVGWeb Base vector graphics APIs Charting & real-time capabilities Data store bindings Drawing APIs Saturday, October 16, 2010
- 14. ? SitePen, Inc. All Rights Reserved Saturday, October 16, 2010
- 15. ? SitePen, Inc. All Rights Reserved Saturday, October 16, 2010
- 16. ? SitePen, Inc. All Rights Reserved Saturday, October 16, 2010
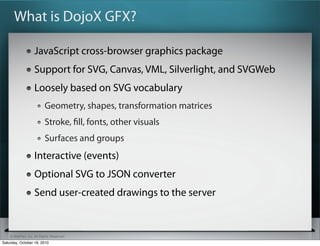
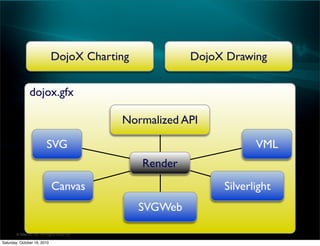
- 17. ? SitePen, Inc. All Rights Reserved What is DojoX GFX? JavaScript cross-browser graphics package Support for SVG, Canvas, VML, Silverlight, and SVGWeb Loosely based on SVG vocabulary Geometry, shapes, transformation matrices Stroke, ?ll, fonts, other visuals Surfaces and groups Interactive (events) Optional SVG to JSON converter Send user-created drawings to the server Saturday, October 16, 2010
- 18. ? SitePen, Inc. All Rights Reserved dojox.gfx DojoX Drawing Normalized API VMLSVG Canvas Silverlight DojoX Charting SVGWeb Render Saturday, October 16, 2010
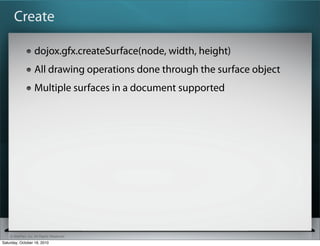
- 19. ? SitePen, Inc. All Rights Reserved Create dojox.gfx.createSurface(node, width, height) All drawing operations done through the surface object Multiple surfaces in a document supported Saturday, October 16, 2010
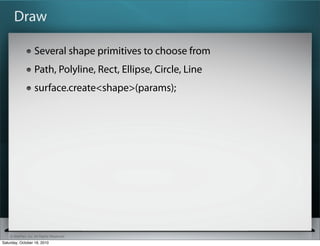
- 20. ? SitePen, Inc. All Rights Reserved Draw Several shape primitives to choose from Path, Polyline, Rect, Ellipse, Circle, Line surface.create<shape>(params); Saturday, October 16, 2010
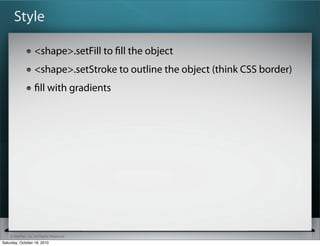
- 21. ? SitePen, Inc. All Rights Reserved Style <shape>.setFill to ?ll the object <shape>.setStroke to outline the object (think CSS border) ?ll with gradients Saturday, October 16, 2010
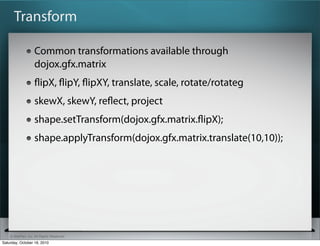
- 22. ? SitePen, Inc. All Rights Reserved Transform Common transformations available through dojox.gfx.matrix ?ipX, ?ipY, ?ipXY, translate, scale, rotate/rotateg skewX, skewY, re?ect, project shape.setTransform(dojox.gfx.matrix.?ipX); shape.applyTransform(dojox.gfx.matrix.translate(10,10)); Saturday, October 16, 2010
- 23. ? SitePen, Inc. All Rights Reserved Group dojox.gfx.VirtualGroup used to group shapes together can be treated as a single unit var g= surface.createGroup(); g.add(shape); Saturday, October 16, 2010
- 24. ? SitePen, Inc. All Rights Reserved Event Using <shape>.getEventSource() to get a direct handle to underlying nodes "Old school" event handling functions expect a normalized event object Connect handlers to event sources: dojo.connect(shape.getEventSource(),ˇ°onmousedownˇ±, onMouseDown); Saturday, October 16, 2010
- 25. ? SitePen, Inc. All Rights Reserved Example Fun with the London Ajax logo Saturday, October 16, 2010
- 26. ? SitePen, Inc. All Rights Reserved DojoX Charting Library DojoˇŻs primary charting library is within DojoX Can use DojoXˇŻs gfx library to create animated e?ects Dozens of themes included, supports custom theming and gradation themes Zooming, panning, and scrolling capabilities Supports chart events Support for SVG, VML, Canvas, Silverlight, and other technologies Support for 2D and 3D charts Integration with Dojo data stores Turns boring, static data into something readable and visually appealing. Saturday, October 16, 2010
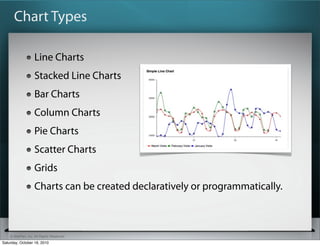
- 27. ? SitePen, Inc. All Rights Reserved Chart Types Line Charts Stacked Line Charts Bar Charts Column Charts Pie Charts Scatter Charts Grids Charts can be created declaratively or programmatically. Saturday, October 16, 2010
- 28. ? SitePen, Inc. All Rights Reserved Chart Pieces ˇ°Chartˇ±- the object which will house the other pieces of the chart Theme - the series of colors and/or gradation information for the chartˇŻs pieces, lines, and markers Plots - describe how data is to be visualized Axes - the dimensions of data that are being visualized and includes things like specifying labels Series - describes the Data itself that the chart will visualize Markers - shapes placed at key points within data Extras - additionalˇ°pluginˇ±functionalities for the chart Saturday, October 16, 2010
- 29. ? SitePen, Inc. All Rights Reserved Chart Plugins and E?ects Tooltip - Shows a tooltip when a chart piece is hovered over Highlight - A hover color e?ect when hovering over a chart piece Magnify - Magni?es a marker when hovered over MoveSlice - Animates a pie slice when hovered over Shake - Shakes a given chart piece when hovered over Saturday, October 16, 2010
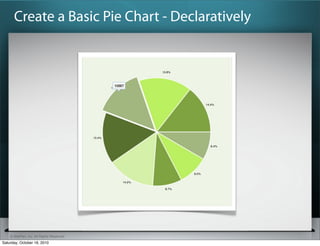
- 30. ? SitePen, Inc. All Rights Reserved <script> //require appropriate charting classes dojo.require(ˇ°dojox.charting.widget.Chart2Dˇ±); dojo.require(ˇ°dojox.charting.themes.PlotKit.greenˇ±); //sample data pieData = [{ x:0, y:9420 }, { x:1, y:10126 }, { x:2, y:10000 }]; </script> //create a pie chart declaratively <div dojoType="dojox.charting.widget.Chart2D" id="viewsChart" theme="dojox.charting.themes.PlotKit.green" style="width: 550px; height: 550px;"> ! <div class="plot" name="default" type="Pie" radius="200" fontColor="black" labelOffset="-20"></div> ! <div class="series" name="January" array="pieData"></div> ! <div class="action" type="Tooltip"></div> ! <div class="action" type="MoveSlice" shift="2"></div> </div> Create a Basic Pie Chart - Declaratively Saturday, October 16, 2010
- 31. ? SitePen, Inc. All Rights Reserved Create a Basic Pie Chart - Declaratively Saturday, October 16, 2010
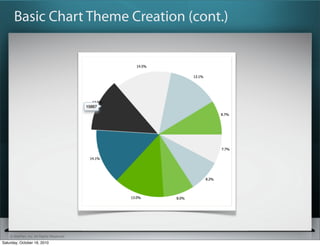
- 32. ? SitePen, Inc. All Rights Reserved Basic Chart Theme Creation (cont.) Saturday, October 16, 2010
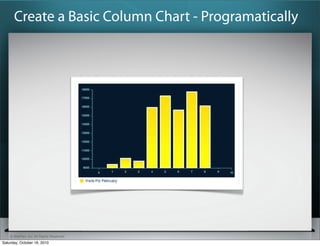
- 33. ? SitePen, Inc. All Rights Reserved <script type="text/javascript"> //require appropriate charting classes dojo.require(ˇ°dojox.charting.widget.Chart2Dˇ±); dojo.require(ˇ°dojox.charting.themes.Tomˇ±); //sample data pieData = [{ x:0,y:9420 },{ x:1,y:10126 },{ x:2,y:10000 }]; dojo.ready(function() { ! var BarChart = new dojox.charting.Chart2D("BarChart"); ! BarChart.setTheme(dojox.charting.themes.Tom); ! BarChart.addAxis("x",{fixUpper: "major",includeZero: false,max:10}); ! BarChart.addAxis("y",{vertical: true,fixLower: "major",fixUpper: "major"}); ! BarChart.addPlot("default",{type: "Columns",gap:5}); ! //add a series of data to the chart ! BarChart.addSeries("My Chart Info",pieData,{}); ! BarChart.render(); }); </script> <div id="BarChart" style="width:500px;height:300px;"></div> Create a Basic Column Chart - Programatically Saturday, October 16, 2010
- 34. ? SitePen, Inc. All Rights Reserved Create a Basic Column Chart - Programatically Saturday, October 16, 2010




![? SitePen, Inc. All Rights Reserved
<script>
//require appropriate charting classes
dojo.require(ˇ°dojox.charting.widget.Chart2Dˇ±);
dojo.require(ˇ°dojox.charting.themes.PlotKit.greenˇ±);
//sample data
pieData = [{ x:0, y:9420 }, { x:1, y:10126 }, { x:2, y:10000 }];
</script>
//create a pie chart declaratively
<div dojoType="dojox.charting.widget.Chart2D" id="viewsChart"
theme="dojox.charting.themes.PlotKit.green" style="width: 550px;
height: 550px;">
! <div class="plot" name="default" type="Pie" radius="200"
fontColor="black" labelOffset="-20"></div>
! <div class="series" name="January" array="pieData"></div>
! <div class="action" type="Tooltip"></div>
! <div class="action" type="MoveSlice" shift="2"></div>
</div>
Create a Basic Pie Chart - Declaratively
Saturday, October 16, 2010](https://image.slidesharecdn.com/webvectorgraphics-101126173416-phpapp02/85/Web-Vector-Graphics-30-320.jpg)
![? SitePen, Inc. All Rights Reserved
<script type="text/javascript">
//require appropriate charting classes
dojo.require(ˇ°dojox.charting.widget.Chart2Dˇ±);
dojo.require(ˇ°dojox.charting.themes.Tomˇ±);
//sample data
pieData = [{ x:0,y:9420 },{ x:1,y:10126 },{ x:2,y:10000 }];
dojo.ready(function() {
! var BarChart = new dojox.charting.Chart2D("BarChart");
! BarChart.setTheme(dojox.charting.themes.Tom);
! BarChart.addAxis("x",{fixUpper: "major",includeZero:
false,max:10});
! BarChart.addAxis("y",{vertical: true,fixLower:
"major",fixUpper: "major"});
! BarChart.addPlot("default",{type: "Columns",gap:5});
! //add a series of data to the chart
! BarChart.addSeries("My Chart Info",pieData,{});
! BarChart.render();
});
</script>
<div id="BarChart" style="width:500px;height:300px;"></div>
Create a Basic Column Chart - Programatically
Saturday, October 16, 2010](https://image.slidesharecdn.com/webvectorgraphics-101126173416-phpapp02/85/Web-Vector-Graphics-33-320.jpg)
