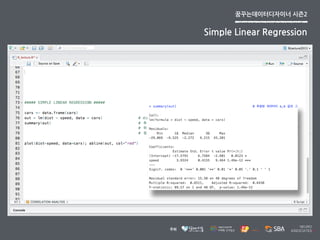
[week9]R_statics
2 likes854 views

кҝҲкҫёөз”лҚ°мқҙн„°л””мһҗмқҙл„Ҳ R_vest к°•мқҳмһҗлЈҢ мһ…лӢҲлӢӨ. www.facebook.com/datadesigner2015
![[week9]R_statics](https://image.slidesharecdn.com/r150916-150916024827-lva1-app6892/85/week9-R_statics-1-320.jpg)


![[Week8]R_ggplot2](https://cdn.slidesharecdn.com/ss_thumbnails/week8rggplot2-150913001335-lva1-app6891-thumbnail.jpg?width=560&fit=bounds)


![[Week2] лҚ°мқҙн„° мҠӨнҒ¬лһҳн•‘](https://cdn.slidesharecdn.com/ss_thumbnails/week2datascraping-150121182810-conversion-gate02-thumbnail.jpg?width=560&fit=bounds)
![[Week20] D3.js_Mapping](https://cdn.slidesharecdn.com/ss_thumbnails/week19mapping-151028033253-lva1-app6892-thumbnail.jpg?width=560&fit=bounds)
![[week17] D3.js_Tooltip](https://cdn.slidesharecdn.com/ss_thumbnails/2d3js7-151021033054-lva1-app6892-thumbnail.jpg?width=560&fit=bounds)
![[week16] D3.js_Transition](https://cdn.slidesharecdn.com/ss_thumbnails/2d3js6-151018032608-lva1-app6891-thumbnail.jpg?width=560&fit=bounds)
![[week8] лҚ°мқҙн„°мқҪм–ҙмЈјлҠ”лӮЁмһҗ](https://cdn.slidesharecdn.com/ss_thumbnails/8final-151016015556-lva1-app6891-thumbnail.jpg?width=560&fit=bounds)
![[Week15] D3.js_Scatter_Chart](https://cdn.slidesharecdn.com/ss_thumbnails/2d3js5-151014035535-lva1-app6892-thumbnail.jpg?width=560&fit=bounds)
![[Week14] D3.js_Scale and Axis (ліҙ충мһҗлЈҢ)](https://cdn.slidesharecdn.com/ss_thumbnails/2d3js42-151011111651-lva1-app6891-thumbnail.jpg?width=560&fit=bounds)
![[Week14] D3.js_Scale and Axis](https://cdn.slidesharecdn.com/ss_thumbnails/week4d3-151011033640-lva1-app6892-thumbnail.jpg?width=560&fit=bounds)
![[Week13] D3.js_Bar Chart](https://cdn.slidesharecdn.com/ss_thumbnails/week3d3-151007011322-lva1-app6892-thumbnail.jpg?width=560&fit=bounds)
![[Week12] D3.js_Basic2](https://cdn.slidesharecdn.com/ss_thumbnails/week2d3-151004003519-lva1-app6891-thumbnail.jpg?width=560&fit=bounds)
![[week7] лҚ°мқҙн„°мқҪм–ҙмЈјлҠ”лӮЁмһҗ](https://cdn.slidesharecdn.com/ss_thumbnails/7-151001021639-lva1-app6892-thumbnail.jpg?width=560&fit=bounds)
![[week6] лҚ°мқҙн„°мқҪм–ҙмЈјлҠ”лӮЁмһҗ](https://cdn.slidesharecdn.com/ss_thumbnails/6-2-151001021527-lva1-app6891-thumbnail.jpg?width=560&fit=bounds)
![[week12] D3.js_Basic](https://cdn.slidesharecdn.com/ss_thumbnails/2d3js1-150930011102-lva1-app6892-thumbnail.jpg?width=560&fit=bounds)
![[week11] R_ggmap, leaflet](https://cdn.slidesharecdn.com/ss_thumbnails/datadesigner-r-07-150923032312-lva1-app6891-thumbnail.jpg?width=560&fit=bounds)
![[week7]R_Wrangling(2)](https://cdn.slidesharecdn.com/ss_thumbnails/datadesigner-r-05-150908144745-lva1-app6891-thumbnail.jpg?width=560&fit=bounds)
![[week6]R_Wrangling](https://cdn.slidesharecdn.com/ss_thumbnails/datadesigner-r-04-150906032721-lva1-app6892-thumbnail.jpg?width=560&fit=bounds)
![[Week5]R_scraping](https://cdn.slidesharecdn.com/ss_thumbnails/week5rscraping-150902002731-lva1-app6891-thumbnail.jpg?width=560&fit=bounds)

![[Week4] Google refine](https://cdn.slidesharecdn.com/ss_thumbnails/week4googlerefinelecture-150830004221-lva1-app6892-thumbnail.jpg?width=560&fit=bounds)


![[мӢңмҰҢ2, week3] R Basic](https://cdn.slidesharecdn.com/ss_thumbnails/datadesigner-r-02-150825143753-lva1-app6891-thumbnail.jpg?width=560&fit=bounds)


More Related Content
More from neuroassociates (20)
[week9]R_statics
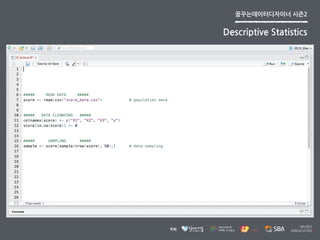
- 8. МэStatistics
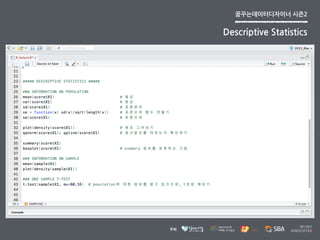
- 11. МэStatistics
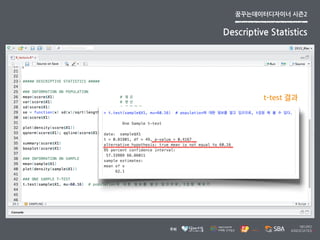
- 14. МэStatistics
- 17. МэStatistics
- 23. МэRegression
- 28. МэліҖмҲҳмқҳ
- 30. МэлҸҷмқҙлҘј
- 31. Мэліҙм—¬мӨҢ
- 32. Мэ л‘җ
- 33. МэліҖмҲҳмқҳ
- 35. Мэк°ҷмңјл©ҙ
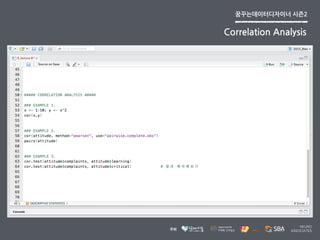
- 36. Мэcov
- 37. Мэ
- 38. Мэ0,
- 39. МэлӢӨлҘҙл©ҙ
- 40. Мэcov
- 41. Мэ
- 42. Мэ0 мғҒкҙҖкі„мҲҳ
- 43. Мэ(Correlation
- 45. МэлӢЁмң„м—җ
- 46. МэмҳҒн–Ҙмқ„
- 47. Мэл°ӣкё°
- 48. Мэл•Ңл¬ём—җ,
- 49. Мэкіө분мӮ°мқ„
- 50. Мэл‘җ
- 51. МэліҖмҲҳмқҳ
- 53. МэкіұмңјлЎң
- 54. Мэ лӮҳлҲ„м–ҙ
- 55. Мэ(-1,1)
- 56. МэмӮ¬мқҙмқҳ
- 57. Мэк°’мқ„
- 58. Мэк°–лҸ„лЎқ
- 59. МэмЎ°м •н•ң
- 60. Мэк°’
- 62. Мэм§Ғм„
- 63. МэкҙҖкі„
- 64. Мэм •лҸ„лҘј
- 65. МэлӮҳнғҖлғ„
- 69. Мэ(Correlation
- 70. Мэcoefficient)
- 71. МэмҳҲм ң
- 75. Мэ(Correlation
- 76. Мэcoefficient)
- 77. МэмҳҲм ң
- 81. Мэ(Correlation
- 82. Мэcoefficient)
- 83. МэмҳҲм ң
- 87. Мэ=/=
- 88. МэCausality
- 91. Мэ(Simple
- 92. МэLinear
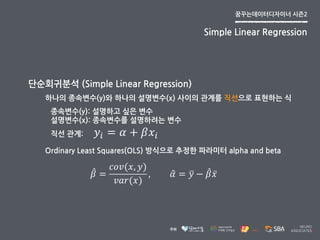
- 95. Мэн•ҳлӮҳмқҳ
- 97. МэмӮ¬мқҙмқҳ
- 98. МэкҙҖкі„лҘј
- 99. Мэм§Ғм„ мңјлЎң
- 100. Мэн‘ңнҳ„н•ҳлҠ”
- 102. Мэм„ӨлӘ…н•ҳкі
- 103. МэмӢ¶мқҖ
- 104. МэліҖмҲҳ
- 105. Мэ м„ӨлӘ…ліҖмҲҳ(x):
- 106. Мэмў…мҶҚліҖмҲҳлҘј
- 107. Мэм„ӨлӘ…н•ҳл ӨлҠ”
- 108. МэліҖмҲҳ !! = ! + !!!! ! м§Ғм„
- 109. МэкҙҖкі„: ! = !#(!, !) !#(!) , ! = ! вҲ’ !!! Ordinary
- 110. МэLeast
- 111. МэSquares(OLS)
- 112. Мэл°©мӢқмңјлЎң
- 113. Мэм¶”м •н•ң
- 114. МэнҢҢлқјлҜён„°
- 115. Мэalpha
- 116. Мэand
- 117. Мэbeta Simple
- 118. МэLinear
- 119. МэRegression
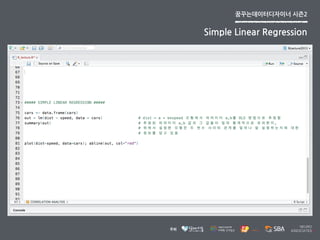
- 121. МэмӢңмҰҢ2 Simple
- 122. МэLinear
- 123. МэRegression
- 125. МэмӢңмҰҢ2 Simple
- 126. МэLinear
- 128. Мэ(Simple
- 129. МэLinear
- 130. МэRegression)
- 131. МэмҳҲм ң
- 133. МэмӢңмҰҢ2 Simple
- 134. МэLinear
- 136. Мэ(Simple
- 137. МэLinear
- 138. МэRegression)
- 139. МэмҳҲм ң
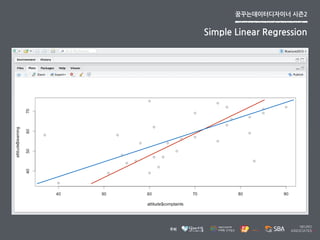
- 144. МэмӢӨмІҙк°Җ
- 145. Мэм–ҙл–Ө
- 146. МэлӘЁмҠөмқ„
- 147. Мэн•ҳкі
- 148. МэмһҲлҠ”м§Җ
- 149. МэлҲҲмңјлЎң
- 150. Мэнҷ•мқё лӢЁмҲңн•ң
- 151. МэмғҒкҙҖкҙҖкі„лҘј
- 152. МэмқёкіјкҙҖкі„лЎң
- 153. МэкіјмһҘн•ҙм„ң
- 154. Мэмғқк°Ғн•ҳкі
- 155. МэмһҲм§ҖлҠ”
- 156. Мэм•ҠмқҖм§Җ
- 157. Мэм җкІҖ
- 162. МэмӢӨмІҙк°Җ
- 163. Мэм–ҙл–Ө
- 164. МэлӘЁмҠөмқ„
- 165. Мэн•ҳкі
- 166. МэмһҲлҠ”м§Җ
- 167. МэлҲҲмңјлЎң
- 168. Мэнҷ•мқё лӢЁмҲңн•ң
- 169. МэмғҒкҙҖкҙҖкі„лҘј
- 170. МэмқёкіјкҙҖкі„лЎң
- 171. МэкіјмһҘн•ҙм„ң
- 172. Мэмғқк°Ғн•ҳкі
- 173. МэмһҲм§ҖлҠ”
- 174. Мэм•ҠмқҖм§Җ
- 175. Мэм җкІҖ
- 176. Neuro Associates гғ» Portfolio : neuroassociates.co.kr/portfolio гғ» Address : м„ңмҡёнҠ№лі„мӢң л§ҲнҸ¬кө¬ мғҒмҲҳлҸҷ 145-1 6F гғ» Site : neuroassociates.co.kr гғ» Mail : neuro.associates.consulting@gmail.com or info@neuroassociates.co.kr гғ» SNS : www.facebook.com/neuroassociatessns гғ» Phone : 02-334-2013