°Ъ°Вұрұр°м2ұХДрғб…ҰДрӢб…өДрҗб…ҘДрӢб…өбҶ°б„ӢРЖҘб„ҢРЖ®бёХРЖібҶ«ДрӮб…ЎбҶ·б„ҢРЖЎ
6 likes999 views

кҝҲкҫёлҠ”лҚ°мқҙн„°л””мһҗмқҙл„Ҳ мӢңмҰҢ2 'лҚ°мқҙн„°мқҪм–ҙмЈјлҠ”лӮЁмһҗ' мҠ¬лқјмқҙл“ң мһ…лӢҲлӢӨ. www.facebook.com/datadesigner2015


°Ъ°Вұрұр°м2ұХДрғб…ҰДрӢб…өДрҗб…ҘДрӢб…өбҶ°б„ӢРЖҘб„ҢРЖ®бёХРЖібҶ«ДрӮб…ЎбҶ·б„ҢРЖЎ
- 2. к№ҖмҳҒмӣ… мЈјк°„ лҚ°мқҙн„° мқҪм–ҙмЈјлҠ” лӮЁмһҗ кҝҲкҫёлҠ” лҚ°мқҙн„° л””мһҗмқҙл„Ҳ л§ӨлӢҲм Җ кІҪмҳҒм •ліҙмӢңмҠӨн…ң м „кіө л°•мӮ¬кіјм • кІҪмҳҒм „л¬ёлҢҖн•ҷмӣҗ MBA м»ҙн“Ён„°кіөн•ҷ м „кіө Ryan Kim | Convergence Business Designer Facebook. https://www.facebook.com/keyassist E-mail. youngwung.kim@gmail.com Web. http://keyassist.tistory.com
- 5. лҚ°мқҙн„° вҶ’ 비주얼мқҳ нҳ•нғң лҚ°мқҙн„° мӢңк°Ғнҷ”вү мқёнҸ¬к·ёлһҳн”Ҫ
- 7. лҚ°мқҙн„°лҘј ліҙлӢӨ мһҳ м „лӢ¬н•ҳлҠ” кІғ
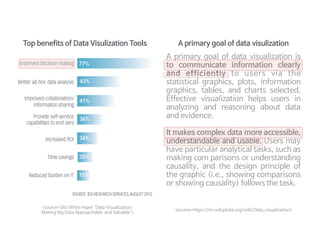
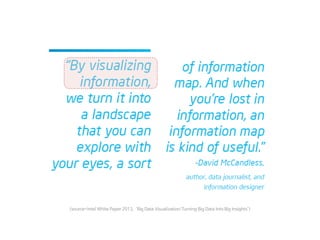
- 8. A primary goal of data visualization is to communicate information clearly and efficiently to users via the statistical graphics, plots,Мэ information graphics, tables, and charts selected. Effective visualization helps users in analyzing and reasoning about data and evidence. It makes complex data more accessible, understandable and usable. Users may have particular analytical tasks, such as making com parisons or understanding causality, and the design principle of the graphic (i.e., showing comparisons or showing causality) follows the task.Мэ <source=SAS White Paper вҖҳData Visualization: Making Big Data Approachable and ValuableвҖҷ> <source=https://en.wikipedia.org/wiki/Data_visualization> Top benefits of Data Visulization Tools A primary goal of data visulization
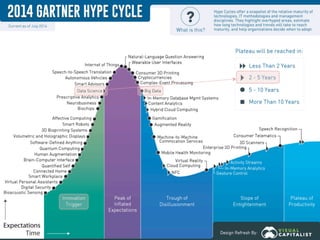
- 10. <source=Intel White Paper 2013, вҖҳBig Data Visualization:Turning Big Data Into Big InsightsвҖҷ>
- 11. лҚ°мқҙн„°кіјн•ҷм—җ лҢҖн•ҙ м ңлҢҖлЎң л°°мҡ°л Өл©ҙ <source=https://www.dataquest.io>
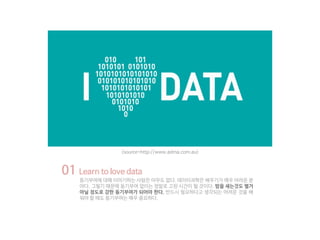
- 12. 01 Learn to love data лҸҷкё°л¶Җм—¬м—җ лҢҖн•ҙ мқҙм•јкё°н•ҳлҠ” мӮ¬лһҢмқҖ м•„л¬ҙлҸ„ м—ҶлӢӨ. лҚ°мқҙн„°кіјн•ҷмқҖ л°°мҡ°кё°к°Җ л§Өмҡ° м–ҙл Өмҡҙ 분 м•јлӢӨ. к·ёл Үкё° л•Ңл¬ём—җ лҸҷкё°л¶Җм—¬ м—ҶмқҙлҠ” м •л§җлЎң кі лҗң мӢңк°„мқҙ лҗ кІғмқҙлӢӨ. л°Өмқ„ мғҲлҠ”кІғлҸ„ лі„кұ° м•„лӢҗ м •лҸ„лЎң к°•н•ң лҸҷкё°л¶Җм—¬к°Җ лҗҳм–ҙм•ј н•ңлӢӨ. л°ҳл“ңмӢң н•„мҡ”н•ҳлӢӨкі мғқк°ҒлҗҳлҠ” м–ҙл Өмҡҙ кІғмқ„ л°° мӣҢм•ј н• л•ҢлҸ„ лҸҷкё°л¶Җм—¬лҠ” л§Өмҡ° мӨ‘мҡ”н•ҳлӢӨ. <source=http://www.adma.com.au>
- 13. 02 Learn by doing лӢ№мӢ мқҳ мһ‘м—…мӨ‘ л¬ҙл Ө 90%к°Җ лҚ°мқҙн„°лҘј м •м ңн•ҳлҠ” лҚ° м“°мқёлӢӨ. лӘҮлӘҮ м•Ңкі лҰ¬л“¬м—җ лҢҖн•ҙ мһҳ м•Ңкі мһҲлҠ” кІғмқҙ л§ҺмқҖ м•Ңкі лҰ¬л“¬м—җ лҢҖн•ҙ м–•кІҢ м•„лҠ” кІғліҙлӢӨ лӮ«лӢӨ. к°ҖмһҘ мӨ‘мҡ”н•ң кұҙ мӢӨм ң н”„лЎңм қнҠёлҘј нҶөн•ҙ л°°мҡ°лҠ” кІғмқҙлӢӨ. к·ёкІғмқ„ нҶөн•ҙ мӢӨм ңлЎң н•„мҡ”н•ҳкі мң мҡ©н•ң мҠӨнӮ¬мқ„ мқөнһҗ мҲҳ мһҲкі нҸ¬нҠёнҸҙлҰ¬ мҳӨлҸ„ л§Ңл“Ө мҲҳ мһҲлӢӨ. мӢӨм ңмқҳ кІҪн—ҳмқ„ нҶөн•ҙ м»Ён…ҚмҠӨнҠёлҘј м–»лҠ” кІғмқҙ л§Өмҡ° мӨ‘мҡ”н•ҳлӢӨ. <source=http://www.minimalwall.com>
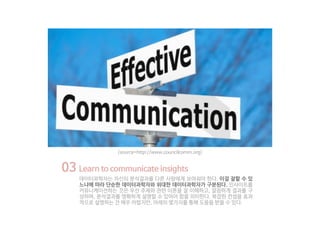
- 14. 03 Learn to communicate insights лҚ°мқҙн„°кіјн•ҷмһҗлҠ” мһҗмӢ мқҳ 분м„қкІ°кіјлҘј лӢӨлҘё мӮ¬лһҢм—җкІҢ ліҙм—¬мӨҳм•ј н•ңлӢӨ. мқҙкұё мһҳн• мҲҳ мһҲ лҠҗлғҗм—җ л”°лқј лӢЁмҲңн•ң лҚ°мқҙн„°кіјн•ҷмһҗмҷҖ мң„лҢҖн•ң лҚ°мқҙн„°кіјн•ҷмһҗк°Җ кө¬л¶„лҗңлӢӨ. мқёмӮ¬мқҙнҠёлҘј м»Өл®ӨлӢҲмјҖмқҙм…ҳн•ҳлҠ” кІғмқҖ мҡ°м„ мЈјм ңмҷҖ кҙҖл Ё мқҙлЎ мқ„ мһҳ мқҙн•ҙн•ҳкі , к№”лҒ”н•ҳкІҢ кІ°кіјлҘј кө¬ м„ұн•ҳл©°, 분м„қкІ°кіјлҘј лӘ…нҷ•н•ҳкІҢ м„ӨлӘ…н• мҲҳ мһҲм–ҙм•ј н•Ёмқ„ мқҳлҜён•ңлӢӨ. ліөмһЎн•ң м»Ём…үмқ„ нҡЁкіј м ҒмңјлЎң м„ӨлӘ…н•ҳлҠ” кұҙ л§Өмҡ° м–ҙл өм§Җл§Ң, м•„лһҳмқҳ лӘҮк°Җм§ҖлҘј нҶөн•ҙ лҸ„мӣҖмқ„ л°ӣмқ„ мҲҳ мһҲлӢӨ. <source=http://www.councilcomm.org>
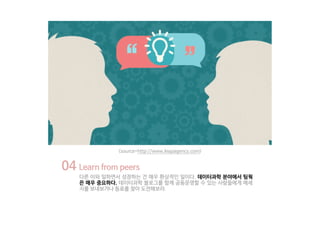
- 15. 04 Learn from peers лӢӨлҘё мқҙмҷҖ мқјн•ҳл©ҙм„ң м„ұмһҘн•ҳлҠ” кұҙ л§Өмҡ° нҷҳмғҒм Ғмқё мқјмқҙлӢӨ. лҚ°мқҙн„°кіјн•ҷ 분야м—җм„ң нҢҖмӣҚ мқҖ л§Өмҡ° мӨ‘мҡ”н•ҳлӢӨ. лҚ°мқҙн„°кіјн•ҷ лё”лЎңк·ёлҘј н•Ёк»ҳ кіөлҸҷмҡҙмҳҒн• мҲҳ мһҲлҠ” мӮ¬лһҢл“Өм—җкІҢ л©”м„ё м§ҖлҘј ліҙлӮҙліҙкұ°лӮҳ лҸҷлЈҢлҘј м°ҫм•„ лҸ„м „н•ҙліҙлқј. <source=http://www.leapagency.com>
- 16. 05 Constantly increase the degree of difficulty лҚ°мқҙн„°кіјн•ҷмқ„ н•ҳлҠ” кұҙ к°ҖнҢҢлҘё мӮ°мқ„ мҳӨлҘҙлҠ” кІғкіј к°ҷлӢӨ. л“ұл°ҳмқ„ л©Ҳм¶ҳлӢӨл©ҙ лӢӨмӢңлҠ” м•„л¬ҙ кІғлҸ„ н• мҲҳ м—ҶлӢӨ. м§ҖкёҲ н•ҳкі мһҲлҠ” н”„лЎңм қнҠёк°Җ мқөмҲҷн•ҙмЎҢкұ°лӮҳ мғҲлЎңмҡҙ м»Ём…үмңјлЎң мӢңлҸ„н•ң м§Җ мҳӨлһҳлҗҳм—ҲлӢӨл©ҙ, мқҙм ңлҠ” лӮңмқҙлҸ„лҘј лҶ’м—¬ лҸ„м „н•ҙм•јн• л•ҢлӢӨ. <source=http://blog.pearson.com>
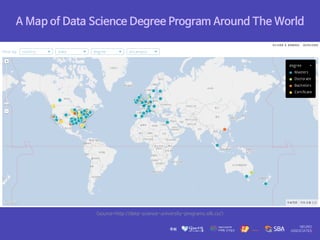
- 17. A Map of Data Science Degree Program Around The World <source=http://data-science-university-programs.silk.co/>
- 18. Top 25 Data Visualization Engineer
- 19. Top 25 Data Visualization Developer
- 20. Next Theme
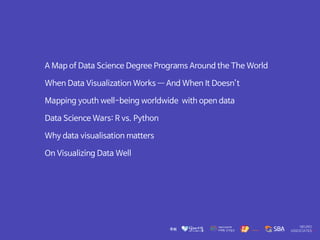
- 21. A Map of Data Science Degree Programs Around the The World When Data Visualization Works вҖ”вҖ• And When It DoesnвҖҷt Mapping youth well-being worldwide with open data Data Science Wars: R vs. Python Why data visualisation matters On Visualizing Data Well
- 22. мЈјк°„ лҚ°мқҙн„°.мқҪм–ҙмЈјлҠ”лӮЁмһҗ Reference http://www.gartner.com https://www.linkedin.com http://www.visualisingdata.com http://www.datavizcatalogue.com https://en.wikipedia.org/wiki/Data_visualization SAS White Paper вҖҳData Visualization: Making Big Data Approachable and ValuableвҖҷ
- 23. NeuroAssociates гғ» Portfolio : neuroassociates.co.kr/portfolio гғ» Address : м„ңмҡёнҠ№лі„мӢң л§ҲнҸ¬кө¬ мғҒмҲҳлҸҷ 145-1 6F гғ» Site : neuroassociates.co.kr гғ» Mail : neuro.associates.consulting@gmail.com or info@neuroassociates.co.kr гғ» SNS : www.facebook.com/neuroassociatessns гғ» Phone : 02-334-2013