Improving Sales Performance with Win/Loss
- 1. Improving Sales Effectiveness with Win/Loss Jason Robert ÔÇô Director, Business Consulting
- 2. Does anyone think Win/Loss analysis is a bad thing?
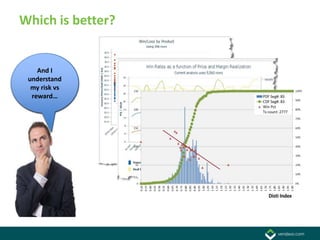
- 3. Which is better? They said they And I need more Clearly I have I understand understand competitive room to my risk vs What will it maneuver tactics ? reward take to win?
- 4. Of course Win/Loss analysis is important, but
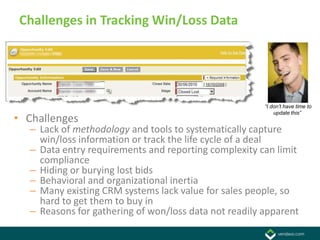
- 5. Challenges in Tracking Win/Loss Data ÔÇ£I donÔÇÖt have time to update thisÔÇØ ÔÇó Challenges ÔÇô Lack of methodology and tools to systematically capture win/loss information or track the life cycle of a deal ÔÇô Data entry requirements and reporting complexity can limit compliance ÔÇô Hiding or burying lost bids ÔÇô Behavioral and organizational inertia ÔÇô Many existing CRM systems lack value for sales people, so hard to get them to buy in ÔÇô Reasons for gathering of won/loss data not readily apparent
- 6. Example 1
- 7. Example 2
- 8. Example 3
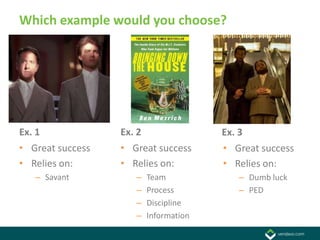
- 9. Which example would you choose? Ex. 1 Ex. 2 Ex. 3 ÔÇó Great success ÔÇó Great success ÔÇó Great success ÔÇó Relies on: ÔÇó Relies on: ÔÇó Relies on: ÔÇô Savant ÔÇô Team ÔÇô Dumb luck ÔÇô Process ÔÇô PED ÔÇô Discipline ÔÇô Information
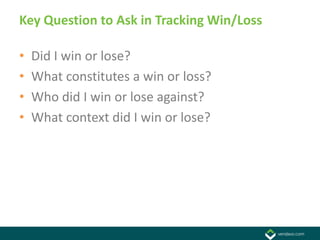
- 10. Key Question to Ask in Tracking Win/Loss ÔÇó Did I win or lose? ÔÇó What constitutes a win or loss? ÔÇó Who did I win or lose against? ÔÇó What context did I win or lose?
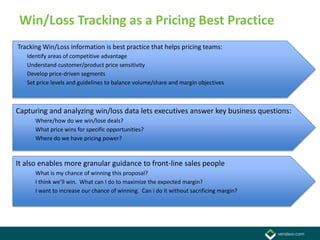
- 11. Win/Loss Tracking as a Pricing Best Practice Tracking Win/Loss information is best practice that helps pricing teams: Identify areas of competitive advantage Understand customer/product price sensitivity Develop price-driven segments Set price levels and guidelines to balance volume/share and margin objectives Capturing and analyzing win/loss data lets executives answer key business questions: Where/how do we win/lose deals? What price wins for specific opportunities? Where do we have pricing power? It also enables more granular guidance to front-line sales people What is my chance of winning this proposal? I think weÔÇÖll win. What can I do to maximize the expected margin? I want to increase our chance of winning. Can I do it without sacrificing margin?
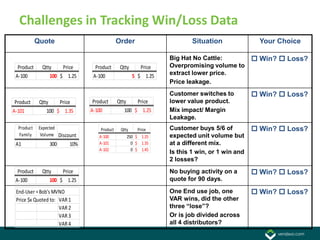
- 12. Challenges in Tracking Win/Loss Data Quote Order Situation Your Choice Big Hat No Cattle: ´ü» Win? ´ü» Loss? Product Qtty Price Product Qtty Price Overpromising volume to A-100 100 $ 1.25 A-100 5 $ 1.25 extract lower price. Price leakage. Customer switches to ´ü» Win? ´ü» Loss? Product Qtty Price Product Qtty Price lower value product. A-101 100 $ 1.35 A-100 100 $ 1.25 Mix impact/ Margin Leakage. Product Expected Product Qtty Price Customer buys 5/6 of ´ü» Win? ´ü» Loss? Family Volume Discount A-100 250 $ 1.25 expected unit volume but A1 300 10% A-101 0 $ 1.35 at a different mix. A-102 0 $ 1.45 Is this 1 win, or 1 win and 2 losses? Product Qtty Price No buying activity on a ´ü» Win? ´ü» Loss? A-100 100 $ 1.25 quote for 90 days. End-User = Bob's MVNO One End use job, one ´ü» Win? ´ü» Loss? Price $x Quoted to: VAR 1 VAR wins, did the other VAR 2 three ÔÇ£loseÔÇØ? VAR 3 Or is job divided across VAR 4 all 4 distributors?
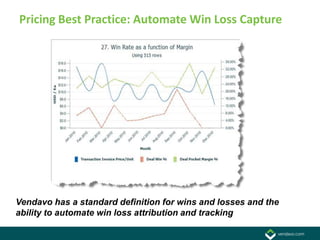
- 13. Pricing Best Practice: Automate Win Loss Capture Vendavo has a standard definition for wins and losses and the ability to automate win loss attribution and tracking
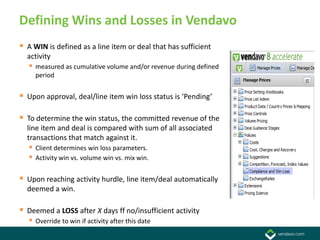
- 14. Defining Wins and Losses in Vendavo ´éº A WIN is defined as a line item or deal that has sufficient activity ´éº measured as cumulative volume and/or revenue during defined period ´éº Upon approval, deal/line item win loss status is ÔÇÿPendingÔÇÖ ´éº To determine the win status, the committed revenue of the line item and deal is compared with sum of all associated transactions that match against it. ´éº Client determines win loss parameters. ´éº Activity win vs. volume win vs. mix win. ´éº Upon reaching activity hurdle, line item/deal automatically deemed a win. ´éº Deemed a LOSS after X days ff no/insufficient activity ´éº Override to win if activity after this date
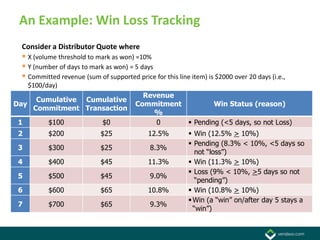
- 15. An Example: Win Loss Tracking Consider a Distributor Quote where ´éº X (volume threshold to mark as won) =10% ´éº Y (number of days to mark as won) = 5 days ´éº Committed revenue (sum of supported price for this line item) is $2000 over 20 days (i.e., $100/day) Revenue Cumulative Cumulative Day Commitment Win Status (reason) Commitment Transaction % 1 $100 $0 0 ´éº Pending (<5 days, so not Loss) 2 $200 $25 12.5% ´éº Win (12.5% > 10%) ´éº Pending (8.3% < 10%, <5 days so 3 $300 $25 8.3% not ÔÇ£lossÔÇØ) 4 $400 $45 11.3% ´éº Win (11.3% > 10%) ´éº Loss (9% < 10%, >5 days so not 5 $500 $45 9.0% ÔÇ£pendingÔÇØ) 6 $600 $65 10.8% ´éº Win (10.8% > 10%) ´éº Win (a ÔÇ£winÔÇØ on/after day 5 stays a 7 $700 $65 9.3% ÔÇ£winÔÇØ)
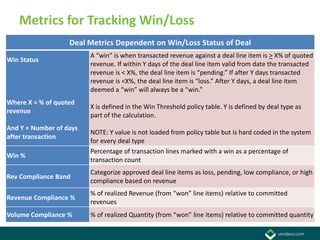
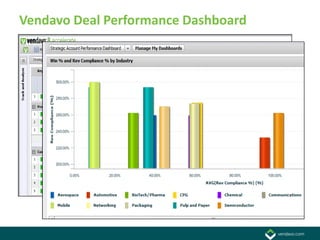
- 16. Metrics for Tracking Win/Loss Deal Metrics Dependent on Win/Loss Status of Deal A ÔÇ£winÔÇØ is when transacted revenue against a deal line item is > X% of quoted Win Status revenue. If within Y days of the deal line item valid from date the transacted revenue is < X%, the deal line item is ÔÇ£pending.ÔÇØ If after Y days transacted revenue is <X%, the deal line item is ÔÇ£loss.ÔÇØ After Y days, a deal line item deemed a ÔÇ£winÔÇØ will always be a ÔÇ£win.ÔÇØ Where X = % of quoted X is defined in the Win Threshold policy table. Y is defined by deal type as revenue part of the calculation. And Y = Number of days NOTE: Y value is not loaded from policy table but is hard coded in the system after transaction for every deal type Percentage of transaction lines marked with a win as a percentage of Win % transaction count Categorize approved deal line items as loss, pending, low compliance, or high Rev Compliance Band compliance based on revenue % of realized Revenue (from ÔÇ£wonÔÇØ line items) relative to committed Revenue Compliance % revenues Volume Compliance % % of realized Quantity (from ÔÇ£wonÔÇØ line items) relative to committed quantity
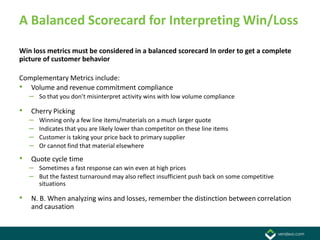
- 17. A Balanced Scorecard for Interpreting Win/Loss Win loss metrics must be considered in a balanced scorecard In order to get a complete picture of customer behavior Complementary Metrics include: ÔÇó Volume and revenue commitment compliance ÔÇô So that you donÔÇÖt misinterpret activity wins with low volume compliance ÔÇó Cherry Picking ÔÇô Winning only a few line items/materials on a much larger quote ÔÇô Indicates that you are likely lower than competitor on these line items ÔÇô Customer is taking your price back to primary supplier ÔÇô Or cannot find that material elsewhere ÔÇó Quote cycle time ÔÇô Sometimes a fast response can win even at high prices ÔÇô But the fastest turnaround may also reflect insufficient push back on some competitive situations ÔÇó N. B. When analyzing wins and losses, remember the distinction between correlation and causation
- 18. Vendavo Deal Performance Dashboard
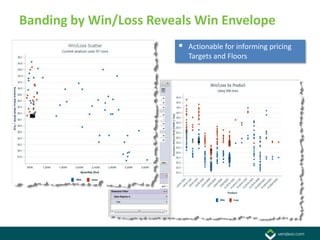
- 19. Banding by Win/Loss Reveals Win Envelope ´éº Actionable for informing pricing Targets and Floors
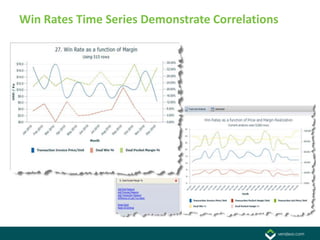
- 20. Win Rates Time Series Demonstrate Correlations
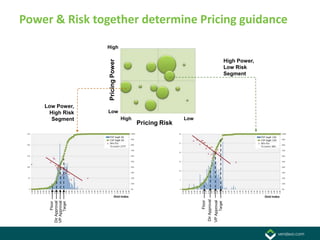
- 22. Power & Risk together determine Pricing guidance High High Power, Pricing Power Low Risk Segment Low Power, High Risk Low Segment High Low Pricing Risk Dir Approval Floor VP Approval Dir Approval VP Approval Target Floor Target
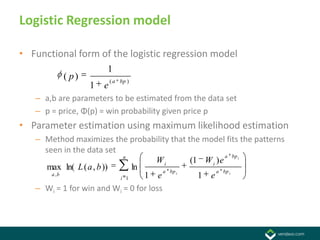
- 23. Logistic Regression model ÔÇó Functional form of the logistic regression model 1 ( p) ( a bp ) 1 e ÔÇô a,b are parameters to be estimated from the data set ÔÇô p = price, ╬ª(p) = win probability given price p ÔÇó Parameter estimation using maximum likelihood estimation ÔÇô Method maximizes the probability that the model fits the patterns seen in the data set n a bp i Wi (1 W i ) e max ln( L ( a , b )) ln a bp i a bp i a ,b i 1 1 e 1 e ÔÇô Wi = 1 for win and Wi = 0 for loss

