
Mobile shopping behaviour
- 1. Mobile shopping behaviour: insights into attitudes, shopping process involvement and location /ņ£ĀĒśäņ¦ä x 2015 Spring
- 2. Mobile shopping behaviour Mobile shopping behaviour: insights into attitudes, shopping process involvement and location Alastair Holmes | Vodafone, Newbury, UK Angela Byrne | Manchester Metropolitan University Business School, Manchester, UK, and Jennifer Rowley | Information and Communications, Manchester Metropolitan University, Manchester, UK International Journal of Retail & Distribution Management Vol. 42 (2012)
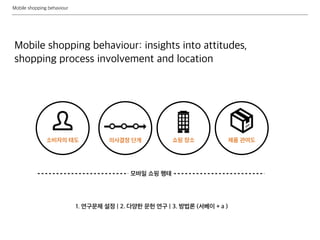
- 3. Mobile shopping behaviour Mobile shopping behaviour: insights into attitudes, shopping process involvement and location ņåīļ╣äņ×ÉņØś Ēā£ļÅä ņć╝ĒĢæ ņןņåī ņĀ£ĒÆł Ļ┤ĆņŚ¼ļÅäņØśņé¼Ļ▓░ņĀĢ ļŗ©Ļ│ä ļ¬©ļ░öņØ╝ ņć╝ĒĢæ Ē¢ēĒā£ 1. ņŚ░ĻĄ¼ļ¼ĖņĀ£ ņäżņĀĢ | 2. ļŗżņ¢æĒĢ£ ļ¼ĖĒŚī ņŚ░ĻĄ¼ | 3. ļ░®ļ▓ĢļĪĀ (ņä£ļ▓ĀņØ┤ + a )
- 4. Mobile shopping behaviour 1) ļ¬©ļ░öņØ╝ ņć╝ĒĢæņŚÉ ļīĆĒĢ£ ņåīļ╣äņ×ÉņØś Ēā£ļÅä Ļ▓░ņĀĢ ņÜöņØĖ, 2) Ļ░ü ņØśņé¼Ļ▓░ņĀĢ ļŗ©Ļ│äņŚÉņä£ņØś ļ¬©ļ░öņØ╝ ņé¼ņÜ® ļ╣äņżæ, 3) ņĀ£ĒÆłņØś Ļ┤ĆņŚ¼ļÅäĻ░Ć ļ¬©ļ░öņØ╝ ņć╝ĒĢæņŚÉ ļü╝ņ╣śļŖö ņśüĒ¢ź, 4) ļ¬©ļ░öņØ╝ ņć╝ĒĢæņØ┤ ņØ┤ļŻ©ņ¢┤ņ¦ĆļŖö ņןņåīņŚÉ ļīĆĒĢ£ ņŚ░ĻĄ¼ <Methodology> ņś©ļØ╝ņØĖ Ēī©ļäÉ ņä£ļ▓ĀņØ┤ (Ēæ£ņ¦æ ņāśĒöī ņłś=1005) <Findings> 1) Ēā£ļÅä Ļ▓░ņĀĢ ņÜöņØĖ: ĒÄĖļ”¼ĒĢ©Ļ│╝ ņĀæĻĘ╝ņä▒ 2) ņØśņé¼Ļ▓░ņĀĢ ļŗ©Ļ│äņŚÉņä£ņØś ļ¬©ļ░öņØ╝ ņé¼ņÜ®: ņĀĢļ│┤ Ļ▓Ćņāē/ļīĆņĢł ĒÅēĻ░Ć>ĻĄ¼ļ¦ż 3) ņĀ£ĒÆłņØś Ļ┤ĆņŚ¼ļÅäĻ░Ć ļ¬©ļ░öņØ╝ ņć╝ĒĢæņŚÉ ļü╝ņ╣śļŖö ņśüĒ¢ź: ļ¬©ļōĀ ņØśņé¼Ļ▓░ņĀĢ ļŗ©Ļ│äņŚÉņä£ ņĀĆĻ┤ĆņŚ¼ ņĀ£ĒÆłļ│┤ļŗż Ļ│ĀĻ┤ĆņŚ¼ ņĀ£ĒÆł ņć╝ĒĢæ ņŗ£ ļ¬©ļ░öņØ╝ ņé¼ņÜ®ņØ┤ ļåÆņØī 4) ļ¬©ļ░öņØ╝ ņć╝ĒĢæņØ┤ ņØ┤ļŻ©ņ¢┤ņ¦ĆļŖö ņןņåī: ņ¦æ>>>>> ņāüņĀÉ > ņć╝ĒĢæ ņä╝Ēä░ 0. Abstract
- 5. Mobile shopping behaviour 1. Introduction - ļ¬©ļ░öņØ╝ ņć╝ĒĢæņŚÉņä£ļŖö Ļ░ĆĻ▓® ĒÖĢņØĖ, ļ¼╝Ļ▒┤ ļ╣äĻĄÉ, ņĀ£ĒÆł ņĀĢļ│┤ ņłśņ¦æ, ļŗżļźĖ ņé¼ņÜ®ņ×ÉņØś ļ”¼ļĘ░ ņØĮĻĖ░ ļō▒Ļ│╝ Ļ░ÖņØĆ ļŗżņ¢æĒĢ£ ĒśĢņŗØņØś ņĀĢļ│┤ ĒÖ£ļÅÖņØ┤ ņØ┤ļŻ©ņ¢┤ņ¦É(Charlton, 2011) - ŌĆśņØ┤ļÅÖņä▒, ņ”ēņŗ£ņä▒, Ļ░£ņØĖĒÖöŌĆÖņÖĆ Ļ░ÖņØĆ ļ¬©ļ░öņØ╝ņØś ĒŖ╣ņä▒ņŚÉ ņØśĒĢ┤ ļ¬©ļ░öņØ╝ ņć╝ĒĢæ Ē¢ēĒā£ļŖö ĻĖ░ņĪ┤ ņś©ļØ╝ņØĖ ņć╝ĒĢæĻ│╝ļŖö ļŗżļźĖ ņ¢æņāü - ŌĆ£ļ¬©ļ░öņØ╝ ņć╝ĒĢæņØś ņä▒Ļ│ĄĻ│╝ ļ░£ņĀäņØä ņ£äĒĢ┤ņä£ļŖö ņåīļ╣äņ×É Ē¢ēļÅÖņŚÉ ļīĆĒĢ£ ņØ┤ĒĢ┤Ļ░Ć ĒĢäņłśņĀüŌĆØ (Hung et al, 2012)
- 6. Mobile shopping behaviour 2. Literature review ņäĀĒ¢ē ņŚ░ĻĄ¼ 1. ļ¬©ļ░öņØ╝ ņć╝ĒĢæ ņłśņÜ®Ļ│╝ Ļ▓ĮĒŚś - ĻĖ░ņłĀņłśņÜ®ļ¬©ļŹĖ(TAM)ņØä ĒÖ£ņÜ®ĒĢ£ ņĀæĻĘ╝ņØ┤ ļīĆļŗżņłś - ļ¬©ļ░öņØ╝ ņ╗żļ©ĖņŖż ņāüĒÖ®ņŚÉ ļ¦×ļŖö revised TAM ļ¬©ļŹĖ ĒÖ£ņÜ®ĒĢ£ ņŚ░ĻĄ¼ - ņć╝ĒĢæ Ļ▓ĮĒŚśņŚÉ ņ׳ņ¢┤ņä£ ņŗżņÜ®ņä▒Ļ│╝ ņŠīļØĮņä▒ņØä Ļ▓░ņĀĢĒĢśļŖö ņÜöņØĖ ņŚ░ĻĄ¼ - ļŗżņ¢æĒĢ£ ņ▒äļäÉņØś ņäĀĒśĖļÅäņŚÉ ļö░ļźĖ ļ¬©ļ░öņØ╝ ņć╝ĒĢæ ņŚ░ĻĄ¼ 2. ņåīļ╣äņ×ÉņØś ņŚ░ĻĄ¼Ļ│╝ ļ¬©ļ░öņØ╝ ļ¦łņ╝ĆĒīģ - ļ¬©ļ░öņØ╝ ĒÅ░ņŚÉ ļīĆĒĢ£ ņåīļ╣äņ×ÉņØś Ēā£ļÅäņÖĆ ļ¬©ļ░öņØ╝ ņć╝ĒĢæ ŌĆ£ņåīļ╣äņ×ÉļōżņØĆ ĻĘĖļōżņØś ļ¬©ļ░öņØ╝ņØä ŌĆ£ņĢäņŻ╝ ņé¼ņĀüņØĖ ĻĖ░ĻĖ░ŌĆØļĪ£ ņØĖņŗØĒĢśĻ│Ā ņ׳ĻĖ░ ļĢīļ¼ĖņŚÉ, Ļ┤æĻ│ĀĻ░Ć ļ¬©ļ░öņØ╝ ĒÅ░ņ£╝ļĪ£ ļōżņ¢┤ņśżĻ▓ī ļÉśļ®┤ ŌĆśĻ░£ņØĖņØś ņé¼ņĀüņØĖ Ļ│ĄĻ░äŌĆØņØä ņ╣©ļ▓ö ļŗ╣Ē¢łļŗżĻ│Ā ņāØĻ░üĒĢśĻĖ░ ļĢīļ¼ĖņŚÉ Ļ▒░ļČĆĻ░ÉņØä ļŖÉļéī - ņåīļ╣äņ×ÉņØś ĻĄ¼ļ¦ż ņØśļÅäĻ░Ć ļ¬©ļ░öņØ╝ ļ¦łņ╝ĆĒīģ ņ░ĖņŚ¼ņŚÉ ļü╝ņ╣śļŖö ņÜöņØĖ ļČäņäØ
- 7. Mobile shopping behaviour ņäĀĒ¢ē ņŚ░ĻĄ¼ņØś ĒĢ£Ļ│ä 1. ļ¬©ļ░öņØ╝ ņć╝ĒĢæ ņłśņÜ®Ļ│╝ Ļ▓ĮĒŚś: ĻĖ░ņĪ┤ ņŚ░ĻĄ¼ļŖö ņåīļ╣äņ×ÉņØś Ē¢ēļÅÖņØä ņČ®ļČäĒ׳ ĒöäļĪ£ĒīīņØ╝ļ¦ü ĒĢśņ¦Ć ļ¬╗ĒĢ© 2. ņåīļ╣äņ×ÉņØś ņŚ░ĻĄ¼Ļ│╝ ļ¬©ļ░öņØ╝ ļ¦łņ╝ĆĒīģ : ĻĖ░ņĪ┤ ņŚ░ĻĄ¼ļŖö ņ┤łĻĖ░ ļ¬©ļ░öņØ╝ ĒģīĒü¼ļåĆļĪ£ņ¦Ćļź╝ ņĀäņĀ£ĒĢśļ»ĆļĪ£, ņŖżļ¦łĒŖĖĒÅ░ ņŗ£ļīĆņØś ņåīļ╣äņ×É Ē¢ēļÅÖ ņŚ░ĻĄ¼ņŚÉļŖö ņĀüĒĢ®ĒĢśņ¦Ć ņĢŖņØī ->ņŖżļ¦łĒŖĖĒÅ░ ņāüĒÖ®ņŚÉ ļ¦×ļŖö ļ¬©ļ░öņØ╝ ņć╝ĒĢæ Ē¢ēĒā£ļź╝ ņåīļ╣äņ×É Ēā£ļÅä/ņØśņé¼Ļ▓░ņĀĢ/ņĀ£ĒÆłņØś Ļ┤ĆņŚ¼ļÅä/ņןņåīļź╝ Ļ│ĀļĀżĒĢśņŚ¼ ļŗżĻ░üļÅäļĪ£ ņé┤ĒÄ┤ļ┤ä RQ 1. ņĀĆĻ┤ĆņŚ¼/ņżæĻ┤ĆņŚ¼/Ļ│ĀĻ┤ĆņŚ¼ņØś ņĀ£ĒÆł ĻĄ¼ļ¦żņŗ£ ņć╝ĒĢæ ĒöäļĪ£ņäĖņŖżņŚÉņä£ ļ¬©ļ░öņØ╝ ņé¼ņÜ®ņØś ļ╣äņżæņØĆ ņ¢┤ļ¢╗Ļ▓ī ļŗ¼ļØ╝ņ¦ĆļŖöĻ░Ć? 2. ņć╝ĒĢæ ĒöäļĪ£ņäĖņŖżņŚÉņä£ ļ¬©ļ░öņØ╝ ņé¼ņÜ®Ļ│╝ Ļ┤ĆļĀ©ļÉ£ ņāüļīĆņĀü ņØĖņŗØ ļ░Å Ēā£ļÅäļź╝ Ļ▓░ņĀĢņ¦ōļŖö ņÜöņØĖņŚÉļŖö ņ¢┤ļ¢ż Ļ▓āņØ┤ ņ׳ļŖöĻ░Ć? 3. ņØśņé¼Ļ▓░ņĀĢ ļŗ©Ļ│ä(ņĀĢļ│┤Ļ▓Ćņāē-ļīĆņĢłĒÅēĻ░Ć-ĻĄ¼ļ¦ż)ņŚÉņä£ ļ¬©ļ░öņØ╝ ņé¼ņÜ® ļ╣äņżæņØĆ ņ¢┤ļ¢╗Ļ▓ī ļÉśļŖöĻ░Ć? 4. ņØśņé¼Ļ▓░ņĀĢ ļŗ©Ļ│äņŚÉņä£, ļ¬©ļ░öņØ╝ ņé¼ņÜ®ņØĆ ĻĄ¼ļ¦ż ņĀ£ĒÆłņØ┤ļéś Ļ┤ĆņŚ¼ļÅäņŚÉ ņØśņĪ┤ĒĢśļŖöĻ░Ć? 5. ņØśņé¼Ļ▓░ņĀĢ ļŗ©Ļ│ä ļ│äļĪ£, ņåīļ╣äņ×ÉļŖö ņ¢┤ļ¢ĀĒĢ£ ņןņåīņŚÉņä£ ļ¬©ļ░öņØ╝ņØä ņé¼ņÜ®ĒĢśļŖöĻ░Ć? 2. Literature review
- 8. Mobile shopping behaviour 3. Methodology ļ”¼ņä£ņ╣ś ļööņ×ÉņØĖ - ņåīļ╣äņ×É Ē¢ēļÅÖ ĒöäļĪ£ĒīīņØ╝ ņłśņ¦æ, ņĀĢļ¤ēņĀü ļČäņäØņØ┤ Ļ░ĆļŖźĒĢśļÅäļĪØ ĒĢśļŖö ņłśņ╣śĒÖöļÉ£ ļŹ░ņØ┤Ēä░ ņłśņ¦æņØä ļ¬®ņĀü - questionnaire-based surveyĻ░Ć Ļ░Ćņן ņĀüĒĢ®ĒĢśļŗżĻ│Ā ĒīÉļŗ© (ņŗ£Ļ░ä/Ļ▓ĮņĀ£ņĀü ļ╣äņÜ®Ļ│╝ ĒÜ©ņ£©ņä▒ ņĖĪļ®┤ Ļ│ĀļĀż) ņäżļ¼Ėņ¦Ć ļööņ×ÉņØĖ - closed questionņØ┤ ņŻ╝ļź╝ ņØ┤ļŻ©ņŚłņ£╝ļ®░, ņØæļŗĄņØś ņØ┤ņ£Āļéś ĻĘ╝Ļ▒░ ĒÖĢļ│┤ļź╝ ņ£äĒĢ┤ open-ended questionļÅä ĒĢ©Ļ╗ś ĒÖ£ņÜ®ĒĢ© - ņ¦łļ¼Ė ļé┤ņÜ®: ņć╝ĒĢæ Ē¢ēļÅÖĻ│╝ Ļ┤ĆļĀ©ļÉ£ ņØ╝ļ░śņĀü ņ¦łļ¼ĖĻ│╝, Ļ░ĆņĀĢņŚÉņä£ ĒØöĒ׳ ļ│╝ ņłś ņ׳ļŖö 6Ļ░Ćņ¦Ć ņĀ£ĒÆł ĻĄ¼ļ¦żņŚÉ Ļ┤ĆĒĢ£ ĻĄ¼ņ▓┤ņĀü ņ¦łļ¼Ė ŌĆó ņĀĆĻ┤ĆņŚ¼- ļ╣Ą, ņøīņŗ▒ ĒīīņÜ░ļŹö ŌĆó ņżæĻ┤ĆņŚ¼- DVD, ņŗĀļ░£ ŌĆó Ļ│ĀĻ┤ĆņŚ¼- TV, ļ¬©ļ░öņØ╝ ĒÅ░ - ņäżļ¼Ėņ¦ĆļŖö ĒĢ£ļ¬ģņØś Ēī©ļäÉļ”¼ņŖżĒŖĖļź╝ ļīĆņāüņ£╝ļĪ£, ĻĄ¼ņĪ░ĒÖöļÉ£ ņØĖĒä░ļĘ░ļź╝ ĒåĄĒĢ┤ 1ņ░© ņé¼ņĀä ĒģīņŖżĒŖĖļź╝ ĒĢśņśĆĻ│Ā, ņłśņĀĢļÉ£ ņ¦łļ¼Ėņ£╝ļĪ£ ļ¬ćļ¬ć Ēī©ļäÉļ”¼ņŖżĒŖĖļź╝ ļīĆņāüņ£╝ļĪ£ 2ņ░© ĒģīņŖżĒŖĖļź╝ ņ¦äĒ¢ē
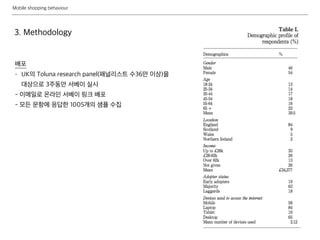
- 9. Mobile shopping behaviour 3. Methodology ļ░░Ēż - UKņØś Toluna research panel(Ēī©ļäÉļ”¼ņŖżĒŖĖ ņłś36ļ¦ī ņØ┤ņāü)ņØä ļīĆņāüņ£╝ļĪ£ 3ņŻ╝ļÅÖņĢł ņä£ļ▓ĀņØ┤ ņŗżņŗ£ - ņØ┤ļ®öņØ╝ļĪ£ ņś©ļØ╝ņØĖ ņä£ļ▓ĀņØ┤ ļ¦üĒü¼ ļ░░Ēż - ļ¬©ļōĀ ļ¼ĖĒĢŁņŚÉ ņØæļŗĄĒĢ£ 1005Ļ░£ņØś ņāśĒöī ņłśņ¦æ
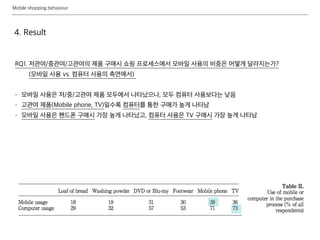
- 10. Mobile shopping behaviour 4. Result RQ1. ņĀĆĻ┤ĆņŚ¼/ņżæĻ┤ĆņŚ¼/Ļ│ĀĻ┤ĆņŚ¼ņØś ņĀ£ĒÆł ĻĄ¼ļ¦żņŗ£ ņć╝ĒĢæ ĒöäļĪ£ņäĖņŖżņŚÉņä£ ļ¬©ļ░öņØ╝ ņé¼ņÜ®ņØś ļ╣äņżæņØĆ ņ¢┤ļ¢╗Ļ▓ī ļŗ¼ļØ╝ņ¦ĆļŖöĻ░Ć? (ļ¬©ļ░öņØ╝ ņé¼ņÜ® vs. ņ╗┤Ēō©Ēä░ ņé¼ņÜ®ņØś ņĖĪļ®┤ņŚÉņä£) - ļ¬©ļ░öņØ╝ ņé¼ņÜ®ņØĆ ņĀĆ/ņżæ/Ļ│ĀĻ┤ĆņŚ¼ ņĀ£ĒÆł ļ¬©ļæÉņŚÉņä£ ļéśĒāĆļé¼ņ£╝ļéś, ļ¬©ļæÉ ņ╗┤Ēō©Ēä░ ņé¼ņÜ®ļ│┤ļŗżļŖö ļé«ņØī - Ļ│ĀĻ┤ĆņŚ¼ ņĀ£ĒÆł(Mobile phone, TV)ņØ╝ņłśļĪØ ņ╗┤Ēō©Ēä░ļź╝ ĒåĄĒĢ£ ĻĄ¼ļ¦żĻ░Ć ļåÆĻ▓ī ļéśĒāĆļé© - ļ¬©ļ░öņØ╝ ņé¼ņÜ®ņØĆ ĒĢĖļō£ĒÅ░ ĻĄ¼ļ¦żņŗ£ Ļ░Ćņן ļåÆĻ▓ī ļéśĒāĆļé¼Ļ│Ā, ņ╗┤Ēō©Ēä░ ņé¼ņÜ®ņØĆ TV ĻĄ¼ļ¦żņŗ£ Ļ░Ćņן ļåÆĻ▓ī ļéśĒāĆļé© ļé© ļé©
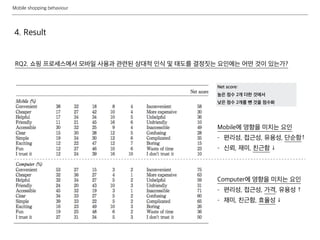
- 11. Mobile shopping behaviour 4. Result RQ2. ņć╝ĒĢæ ĒöäļĪ£ņäĖņŖżņŚÉņä£ ļ¬©ļ░öņØ╝ ņé¼ņÜ®Ļ│╝ Ļ┤ĆļĀ©ļÉ£ ņāüļīĆņĀü ņØĖņŗØ ļ░Å Ēā£ļÅäļź╝ Ļ▓░ņĀĢņ¦ōļŖö ņÜöņØĖņŚÉļŖö ņ¢┤ļ¢ż Ļ▓āņØ┤ ņ׳ļŖöĻ░Ć? MobileņŚÉ ņśüĒ¢źņØä ļ»Ėņ╣śļŖö ņÜöņØĖ - ĒÄĖļ”¼ņä▒, ņĀæĻĘ╝ņä▒, ņ£ĀņÜ®ņä▒, ļŗ©ņł£ĒĢ©Ōåæ - ņŗĀļó░, ņ×¼ļ»Ė, ņ╣£ĻĘ╝ĒĢ© Ōåō ComputerņŚÉ ņśüĒ¢źņØä ļ»Ėņ╣śļŖö ņÜöņØĖ - ĒÄĖļ”¼ņä▒, ņĀæĻĘ╝ņä▒, Ļ░ĆĻ▓®, ņ£ĀņÜ®ņä▒ Ōåæ - ņ×¼ļ»Ė, ņ╣£ĻĘ╝ĒĢ©, ĒÜ©ņ£©ņä▒ Ōåō Net score: ļåÆņØĆ ņĀÉņłś 2Ļ░£ ļŹöĒĢ£ Ļ▓āņŚÉņä£ ļé«ņØĆ ņĀÉņłś 2Ļ░£ļź╝ ļ║Ć Ļ▓āņØä ņĀÉņłśĒÖö
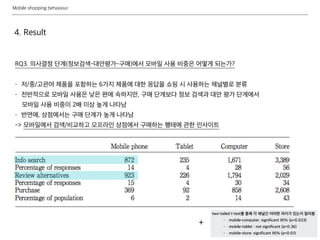
- 12. Mobile shopping behaviour 4. Result RQ3. ņØśņé¼Ļ▓░ņĀĢ ļŗ©Ļ│ä(ņĀĢļ│┤Ļ▓Ćņāē-ļīĆņĢłĒÅēĻ░Ć-ĻĄ¼ļ¦ż)ņŚÉņä£ ļ¬©ļ░öņØ╝ ņé¼ņÜ® ļ╣äņżæņØĆ ņ¢┤ļ¢╗Ļ▓ī ļÉśļŖöĻ░Ć? - ņĀĆ/ņżæ/Ļ│ĀĻ┤ĆņŚ¼ ņĀ£ĒÆłņØä ĒżĒĢ©ĒĢśļŖö 6Ļ░Ćņ¦Ć ņĀ£ĒÆłņŚÉ ļīĆĒĢ£ ņØæļŗĄņØä ņć╝ĒĢæ ņŗ£ ņé¼ņÜ®ĒĢśļŖö ņ▒äļäÉļ│äļĪ£ ļČäļźś - ņĀäļ░śņĀüņ£╝ļĪ£ ļ¬©ļ░öņØ╝ ņé¼ņÜ®ņØĆ ļé«ņØĆ ĒÄĖņŚÉ ņåŹĒĢśņ¦Ćļ¦ī, ĻĄ¼ļ¦ż ļŗ©Ļ│äļ│┤ļŗż ņĀĢļ│┤ Ļ▓ĆņāēĻ│╝ ļīĆņĢł ĒÅēĻ░Ć ļŗ©Ļ│äņŚÉņä£ ļ¬©ļ░öņØ╝ ņé¼ņÜ® ļ╣äņżæņØ┤ 2ļ░░ ņØ┤ņāü ļåÆĻ▓ī ļéśĒāĆļé© - ļ░śļ®┤ņŚÉ, ņāüņĀÉņŚÉņä£ļŖö ĻĄ¼ļ¦ż ļŗ©Ļ│äĻ░Ć ļåÆĻ▓ī ļéśĒāĆļé© -> ļ¬©ļ░öņØ╝ņŚÉņä£ Ļ▓Ćņāē/ļ╣äĻĄÉĒĢśĻ│Ā ņśżĒöäļØ╝ņØĖ ņāüņĀÉņŚÉņä£ ĻĄ¼ļ¦żĒĢśļŖö Ē¢ēĒā£ņŚÉ Ļ┤ĆĒĢ£ ņØĖņé¼ņØ┤ĒŖĖ two-tailed t-testļź╝ ĒåĄĒĢ┤ Ļ░ü ņ▒äļäÉĻ░ä ņ¢┤ļ¢ĀĒĢ£ ņ░©ņØ┤Ļ░Ć ņ׳ļŖöņ¦Ć ņĢīņĢäļ┤ä ŌĆó mobile-computer: significant 95% (p=0.023) ŌĆó mobile-tablet : not significant (p=0.36) ŌĆó mobile-store: significant 95% (p=0.01) +
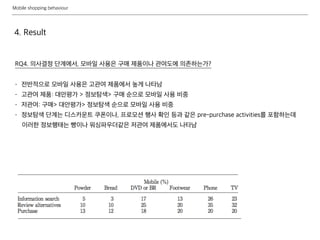
- 13. Mobile shopping behaviour 4. Result RQ4. ņØśņé¼Ļ▓░ņĀĢ ļŗ©Ļ│äņŚÉņä£, ļ¬©ļ░öņØ╝ ņé¼ņÜ®ņØĆ ĻĄ¼ļ¦ż ņĀ£ĒÆłņØ┤ļéś Ļ┤ĆņŚ¼ļÅäņŚÉ ņØśņĪ┤ĒĢśļŖöĻ░Ć? - ņĀäļ░śņĀüņ£╝ļĪ£ ļ¬©ļ░öņØ╝ ņé¼ņÜ®ņØĆ Ļ│ĀĻ┤ĆņŚ¼ ņĀ£ĒÆłņŚÉņä£ ļåÆĻ▓ī ļéśĒāĆļé© - Ļ│ĀĻ┤ĆņŚ¼ ņĀ£ĒÆł: ļīĆņĢłĒÅēĻ░Ć > ņĀĢļ│┤ĒāÉņāē> ĻĄ¼ļ¦ż ņł£ņ£╝ļĪ£ ļ¬©ļ░öņØ╝ ņé¼ņÜ® ļ╣äņżæ - ņĀĆĻ┤ĆņŚ¼: ĻĄ¼ļ¦ż> ļīĆņĢłĒÅēĻ░Ć> ņĀĢļ│┤ĒāÉņāē ņł£ņ£╝ļĪ£ ļ¬©ļ░öņØ╝ ņé¼ņÜ® ļ╣äņżæ - ņĀĢļ│┤ĒāÉņāē ļŗ©Ļ│äļŖö ļööņŖżņ╣┤ņÜ┤ĒŖĖ ņ┐ĀĒÅ░ņØ┤ļéś, ĒöäļĪ£ļ¬©ņģś Ē¢ēņé¼ ĒÖĢņØĖ ļō▒Ļ│╝ Ļ░ÖņØĆ pre-purchase activitiesļź╝ ĒżĒĢ©ĒĢśļŖöļŹ░ ņØ┤ļ¤¼ĒĢ£ ņĀĢļ│┤Ē¢ēĒā£ļŖö ļ╣ĄņØ┤ļéś ņøīņŗ▒ĒīīņÜ░ļŹöĻ░ÖņØĆ ņĀĆĻ┤ĆņŚ¼ ņĀ£ĒÆłņŚÉņä£ļÅä ļéśĒāĆļé©
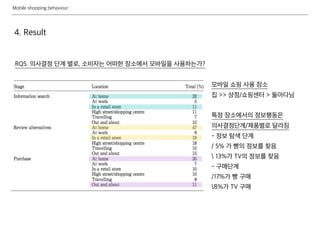
- 14. Mobile shopping behaviour 4. Result RQ5. ņØśņé¼Ļ▓░ņĀĢ ļŗ©Ļ│ä ļ│äļĪ£, ņåīļ╣äņ×ÉļŖö ņ¢┤ļ¢ĀĒĢ£ ņןņåīņŚÉņä£ ļ¬©ļ░öņØ╝ņØä ņé¼ņÜ®ĒĢśļŖöĻ░Ć? ļ¬©ļ░öņØ╝ ņć╝ĒĢæ ņé¼ņÜ® ņןņåī ņ¦æ >> ņāüņĀÉ/ņć╝ĒĢæņä╝Ēä░ > ļÅīņĢäļŗżļŗś ĒŖ╣ņĀĢ ņןņåīņŚÉņä£ņØś ņĀĢļ│┤Ē¢ēļÅÖņØĆ ņØśņé¼Ļ▓░ņĀĢļŗ©Ļ│ä/ņĀ£ĒÆłļ│äļĪ£ ļŗ¼ļØ╝ņ¦É - ņĀĢļ│┤ ĒāÉņāē ļŗ©Ļ│ä / 5% Ļ░Ć ļ╣ĄņØś ņĀĢļ│┤ļź╝ ņ░ŠņØī 13%Ļ░Ć TVņØś ņĀĢļ│┤ļź╝ ņ░ŠņØī - ĻĄ¼ļ¦żļŗ©Ļ│ä /17%Ļ░Ć ļ╣Ą ĻĄ¼ļ¦ż 8%Ļ░Ć TV ĻĄ¼ļ¦ż
- 15. Mobile shopping behaviour 5. Conclusion 1) ļ¬©ļ░öņØ╝ ņć╝ĒĢæņŚÉ ļīĆĒĢ£ ņåīļ╣äņ×ÉņØś Ēā£ļÅä Ļ▓░ņĀĢ ņÜöņØĖ - ĒÄĖļ”¼ņä▒, ņĀæĻĘ╝ņä▒, ņ£ĀņÜ®ņä▒, ļŗ©ņł£ĒĢ©ņØĆ ņśüĒ¢źņØä ļ¦ÄņØ┤ ļ»Ėņ╣śĻ│Ā, ņāüļīĆņĀüņ£╝ļĪ£ ņŗĀļó░, ņ×¼ļ»Ė, ņ╣£ĻĘ╝ĒĢ©ņØĆ ņśüĒ¢źņØä ņĀüĻ▓ī ļ»Ėņ╣© 2) ņØśņé¼Ļ▓░ņĀĢ ļŗ©Ļ│äņŚÉņä£ņØś ļ¬©ļ░öņØ╝ ņé¼ņÜ® ļ╣äņżæ - ļīĆņĢł ĒÅēĻ░Ć > ņĀĢļ│┤ ĒāÉņāē > ĻĄ¼ļ¦ż ņł£ņ£╝ļĪ£ ļ¬©ļ░öņØ╝ ņé¼ņÜ® ļ╣äņżæņØ┤ ļåÆĻ▓ī ļéśĒāĆļé© 3) ņĀ£ĒÆłņØś Ļ┤ĆņŚ¼ļÅäĻ░Ć ļ¬©ļ░öņØ╝ ņć╝ĒĢæņŚÉ ļü╝ņ╣śļŖö ņśüĒ¢ź - ņĀ£ĒÆł Ļ┤ĆņŚ¼ļÅäĻ░Ć ļåÆņØäņłśļĪØ ļ¬©ļ░öņØ╝ ņé¼ņÜ® ļ╣äņżæņØ┤ ļåÆĻ▓ī ļéśĒāĆļé© 4) ļ¬©ļ░öņØ╝ ņć╝ĒĢæņØ┤ ņØ┤ļŻ©ņ¢┤ņ¦ĆļŖö ņןņåīņŚÉ ļīĆĒĢ£ ņŚ░ĻĄ¼ - Ļ░Ćņן ļ¬©ļ░öņØ╝ ņć╝ĒĢæņØ┤ ņ×ÉņŻ╝ ļ▓īņ¢┤ņ¦ĆļŖö Ļ│ĄĻ░äņØĆ ŌĆśņ¦æŌĆÖ - ņ¦æ > ņāüņĀÉ/ņć╝ĒĢæņä╝Ēä░ > ļÅīņĢäļŗżļŗłļ®┤ņä£ ņć╝ĒĢæ ņł£ņ£╝ļĪ£ ļåÆĻ▓ī ļéśĒāĆļé©
- 16. Mobile shopping behaviour 6. Implications 1) ļ¬©ļ░öņØ╝ ņć╝ĒĢæ ņé¼ņÜ® Ē¢ēĒā£ ņĪ░ņé¼ Ļ▓░Ļ│╝ Ļ│ĀņĀĢļÉ£ Ļ│ĄĻ░äĻ│╝, ņØ┤ļÅÖ Ļ│ĄĻ░äņØä ļäśļéśļōżļ®░ ņć╝ĒĢæ Ē¢ēĒā£Ļ░Ć ļ▓īņ¢┤ņ¦É ņØ┤ļ¤¼ĒĢ£ ņĀÉņŚÉņä£, ņś©ļØ╝ņØĖ ņć╝ĒĢæĻ│╝ ĻĄ¼ļČäļÉ© -> ŌĆśņØ┤ļÅÖņä▒ŌĆÖņØä Ļ│ĀļĀżĒĢśņŚ¼ ļ¬©ļ░öņØ╝ ņć╝ĒĢæ Ļ▓ĮĒŚś ļööņ×ÉņØĖĒĢĀ Ļ▓ā 2) ļ¬©ļ░öņØ╝ņŚÉņä£ ņĀĢļ│┤ļź╝ Ļ▓Ćņāē, ļīĆņĢłņØä ļ╣äĻĄÉ -> ņāüņĀÉ/ņś©ļØ╝ņØĖņŚÉņä£ ĻĄ¼ļ¦żĒĢśļŖö Ē¢ēĒā£ņŚÉ Ļ┤ĆĒĢ£ ņØĖņé¼ņØ┤ĒŖĖļź╝ ļ░£Ļ▓¼ ņś©ņśżĒöäļØ╝ņØĖ ļ®ĆĒŗ░ ņ▒äļäÉņØä ĒÖ£ņÜ®ĒĢ£ ļ¦łņ╝ĆĒīģņŚÉ ņĀüĻĘ╣ ĒÖ£ņÜ®ĒĢĀ ņłś ņ׳ņØä Ļ▓ā 3) ņé¼ņÜ®ņ×ÉĻ░Ć ļ¬©ļ░öņØ╝ ņć╝ĒĢæņØä ĒĢśļŖö ŌĆśņןņåīŌĆÖņŚÉ ļīĆĒĢ£ ņĀĢļ│┤ļź╝ ĒīīņĢģĒĢśņŚ¼, ņé¼ņÜ®ņ×ÉņŚÉĻ▓ī ņ╗żņŖżĒä░ļ¦łņØ┤ņ¦ĢļÉ£ ņ╗żļ«żļŗłņ╝ĆņØ┤ņģśņØä ņĀ£Ļ│ĄĒĢĀ ņłś ņ׳ņØä Ļ▓ā
- 17. Mobile shopping behaviour - ņŗżĒŚś ļ░®ļ▓Ģ ļ│┤ņÖä ļ¼ĖņĀ£: ņåīļ╣äņ×ÉņØś ļ¬©ļ░öņØ╝ ņć╝ĒĢæ Ļ▓ĮĒŚśņØä ņØ┤ĒĢ┤ĒĢśĻĖ░ ņ£äĒĢ┤ņä£ļŖö ļŗ©ņł£ ņä£ļ▓ĀņØ┤ ļīĆņŗĀņŚÉ ņØĖĒä░ļĘ░ ļō▒ņØś ņ¦łņĀü ņŚ░ĻĄ¼ļź╝ ļ░öĒāĢņ£╝ļĪ£ ļ¼ĖņĀ£ ņāüĒÖ®ņØä ņŗ¼ņĖĄņĀüņ£╝ļĪ£ ĒīīņĢģĒĢĀ ĒĢäņÜöĻ░Ć ņ׳ņØī ņĀ£ĒÆłĻĄ░ ņäĀņĀĢ ļ¼ĖņĀ£: Ļ┤ĆņŚ¼ļÅäļŖö ņĀ£ĒÆłņØś ņóģļźś/ĒŖ╣ņä▒ņŚÉ ļö░ļØ╝ņä£ ņŚäņ▓ŁļéśĻ▓ī ļŗ¼ļØ╝ņ¦łļō» Ļ░ÖņØĆ Ļ│ĀĻ┤ĆņŚ¼ ņĀ£ĒÆłņØ┤ņ¦Ćļ¦ī TVņÖĆ ņ×ÉļÅÖņ░© ĻĄ¼ļ¦żļź╝ ņ£äĒĢ£ ņĀĢļ│┤Ē¢ēĒā£ļŖö ļŗżļźĖ ņ¢æņāüņØä ļ│┤ņØ╝ Ļ▓āņØ┤ļØ╝ ņśłņāü... ņŚ░ĻĄ¼ņŚÉ ĒÖ£ņÜ®ĒĢ£ ņĀ£ĒÆłĻĄ░ņŚÉ ļīĆĒĢ£ Ļ░ØĻ┤ĆņĀüņØĖ ĻĘ╝Ļ▒░Ļ░Ć ĒĢäņÜöĒĢ© ĻĖ░ĒāĆ: ņś©ļØ╝ņØĖ ņć╝ĒĢæ/ļ¬©ļ░öņØ╝ ņć╝ĒĢæ/ņśżĒöäļØ╝ņØĖ ņć╝ĒĢæ Ļ▓ĮĒŚśņØĆ Ļ│ĄĒåĄņĀÉĻ│╝ ņ░©ņØ┤ņĀÉņØ┤ ņĪ┤ņ×¼ĒĢĀ Ļ▓āņØ┤ļØ╝ ņśłņāü Ļ░ü ņ▒äļäÉļ│äļĪ£ ņĀĢļ│┤ņČöĻĄ¼ Ē¢ēĒā£ļŖö ņ¢┤ļ¢ż ĒŖ╣ņ¦ĢņØä ļéśĒāĆļé┤ļŖöņ¦Ć ņĪ░ņé¼ĒĢ┤ļ┤ÉņĢ╝ ĒĢĀ ĒĢäņÜö... ļŗżņ¢æĒĢ£ ņć╝ĒĢæ ņ▒äļäÉņØ┤ Ēś╝ņ×¼ļÉśņ¢┤ ļéśĒāĆļéśļŖö ļ¼ĖņĀ£ļōż->ĒĢśļéśņØś ņ▒äļäÉņŚÉņä£ ĒĢ┤Ļ▓░? ļ®ĆĒŗ░ņ▒äļäÉ ņŚ░Ļ│äļĪ£ ĒĢ┤Ļ▓░? ĒĢśļéśņØś ņĀ£ĒÆłņØä ĻĄ¼ļ¦żĒĢśĻĖ░ ņ£äĒĢ┤ ņé¼ļ×īļōżņØĆ ļ®öļ¬©, ņ║Īņ│É, ņ╣┤ĒåĪ ļīĆĒÖö, ļČüļ¦łĒü¼, ļ”¼ļĘ░, Ļ░ĆĻ▓®ļ╣äĻĄÉ ņé¼ņØ┤ĒŖĖ, ņ¦ĆņØĖņØś ļ¦É ļō▒ ĻĄēņןĒ׳ ļ¦ÄņØĆ ņĀĢļ│┤ļōżņØä ņĀæĒĢśĻ▓ī ļÉśļŖöļŹ░, ņØ┤ļ¤¼ĒĢ£ ņĀĢļ│┤ļōżņØä ļ¼Čņ¢┤ņä£ ļ│┤ļŖö Ļ▓āņØ┤ ņØśņé¼Ļ▓░ņĀĢņŚÉ ļÅäņøĆņØ┤ ļÉĀĻ╣ī??? (ņ╗┤Ēō©Ēä░ņŚÉņä£ ņāł ĒÅ┤ļŹöņŚÉ ļŗżņ¢æĒĢ£ ĒīīņØ╝ļōżņØä ĻĘĖļŻ╣ĒĢæĒĢśļō»)
- 18. Mobile shopping behaviour Thank you!