


More Related Content
What's hot (20)
Similar to Quality assurance (20)


More from Michael Karpov (20)


Quality assurance
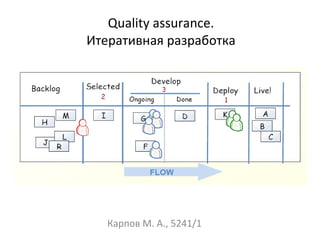
- 1. Quality assurance. ąśč鹥čĆą░čéąĖą▓ąĮą░čÅ čĆą░ąĘčĆą░ą▒ąŠčéą║ą░ ąÜą░čĆą┐ąŠą▓ ą£. ąÉ., 5241/1
- 2. QA ( quality assurance ) ąØą░ čĆčāčüčüą║ąĖą╣ čÅąĘčŗą║ čŹč鹊 ą╝ąŠąČąĮąŠ ą┐ąĄčĆąĄą▓ąĄčüčéąĖ ą║ą░ą║ "ą┐čĆąŠą▓ąĄčĆą║ą░ ą║ą░č湥čüčéą▓ą░", čģąŠčéčÅ ąŠą▒čŗčćąĮąŠ ą│ąŠą▓ąŠčĆčÅčé ą┐čĆąŠčüč鹊 ąŠ č鹥čüčéąĖčĆąŠą▓ą░ąĮąĖąĖ. ąŁč鹊 ą┐čĆąŠčåąĄčüčü, ą║ąŠč鹊čĆčŗą╣ ą┐ąŠąĘą▓ąŠą╗čÅąĄčé ą┐čĆąŠą▓ąĄčĆąĖčéčī čüąŠąŠčéą▓ąĄčéčüčéą▓ąĖąĄ čĆą░ąĘčĆą░ą▒ąŠčéą░ąĮąĮąŠą│ąŠ ą┐čĆąŠą│čĆą░ą╝ą╝ąĮąŠą│ąŠ ąŠą▒ąĄčüą┐ąĄč湥ąĮąĖčÅ čüčéą░ąĮą┤ą░čĆčéą░ą╝, ą║ąŠč鹊čĆčŗąĄ ą▒čŗą╗ąĖ ąĘą░ą┤ą░ąĮčŗ ąĮą░ čŹčéą░ą┐ąĄ ą┐čĆąŠąĄą║čéąĖčĆąŠą▓ą░ąĮąĖčÅ.
- 3. ╠²
- 4. ą¤čĆąŠąĄą║čéąĖčĆąŠą▓ą░ąĮąĖąĄ ą£čŗ ą┐čŗčéą░ąĄą╝čüčÅ ą┐ąŠčüčéčĆąŠąĖčéčī čĆą░ą▒ąŠčéą░čÄčēčāčÄ čüąĖčüč鹥ą╝čā, ą║ąŠč鹊čĆą░čÅ ą┤ąŠą╗ąČąĮą░ čćč鹊-č鹊 ą▓čŗą┤ą░ą▓ą░čéčī ąĮą░ ą▓čŗčģąŠą┤ąĄ, ą░ ąĖą╝ąĄąĮąĮąŠ ŌĆö ą┐čĆąŠą│čĆą░ą╝ą╝ąĮčŗą╣ ą┐čĆąŠą┤čāą║čé. ąŻ ąĮą░čü ąĄčüčéčī ą╗čÄą┤ąĖ, ąĖąĘ ą║ąŠč鹊čĆčŗčģ ą╝čŗ ą▓ąŠčé čŹčéčā čüąĖčüč鹥ą╝čā čüčéčĆąŠąĖą╝. ą¦č鹊 ąĮčāąČąĮąŠ čüą┤ąĄą╗ą░čéčī, čćč鹊ą▒čŗ čüąĖčüč鹥ą╝ą░ ąĖąĘ ąĮąĄąĮą░ą┤ąĄąČąĮčŗčģ 菹╗ąĄą╝ąĄąĮč鹊ą▓ čĆą░ą▒ąŠčéą░ą╗ą░? ąØčāąČąĮąŠ ąĄčæ čüą┤ąĄą╗ą░čéčī čü ąŠą│čĆąŠą╝ąĮąŠą╣ ąĖąĘą▒čŗč鹊čćąĮąŠčüčéčīčÄ.
- 5. ąĢčēčæ ą▓ą░čĆąĖą░ąĮčéčŗ? ąØą░ą┤ąŠ čāą╝ąĄąĮčīčłąĖčéčī čĆą░ąĘą╝ąĄčĆ ą║ąŠą╝ą░ąĮą┤čŗ. ą¤ąŠč湥ą╝čā? ąŚą░ čüč湥čé čŹč鹊ą│ąŠ ą▓čŗ ą┐ąŠą▓čŗčłą░ąĄč鹥 ąÜą¤ąö ąĄčæ ąŠčéą┤ąĄą╗čīąĮčŗčģ 菹╗ąĄą╝ąĄąĮč鹊ą▓, ą▓čŗ ą┐ąŠąĘą▓ąŠą╗čÅąĄč鹥 ąĖą╝ ąŠą║ą░ąĘčŗą▓ą░čéčī ą▒ąŠą╗čīčłąĄąĄ ą▓ą╗ąĖčÅąĮąĖąĄ ąĮą░ ąŠą▒čēąĖą╣ čĆąĄąĘčāą╗čīčéą░čé čĆą░ą▒ąŠčéčŗ čüąĖčüč鹥ą╝čŗ ąĘą░ čüč湥čé čāą╝ąĄąĮčīčłąĄąĮąĖčÅ ą║ąŠą╗ąĖč湥čüčéą▓ą░ čüą▓čÅąĘąĄą╣, ą║ąŠč鹊čĆčŗąĄ ą║ą░ą║ čĆą░ąĘ ą▓čüčæ čŹč鹊 ąÜą¤ąö ą│ą░čüčÅčé. ąöą╗čÅ ą┐ąŠą▓čŗčłąĄąĮąĖčÅ ąÜą¤ąö ą╝čŗ ą┤ąĄą╗ą░ąĄą╝ ąĮąĄąĮą░ą┤čæąČąĮčāčÄ čüąĖčüč鹥ą╝čā, ąĮąŠ ąĘą░č鹊 ąŠąĮą░ ą┤ą░čæčé ąŠč湥ąĮčī čŹčäč乥ą║čéąĖą▓ąĮčŗą╣ čĆąĄąĘčāą╗čīčéą░čé.
- 6. ąóąĄąĮą┤ąĄąĮčåąĖąĖ ą¤ąĄčĆąĄčģąŠą┤ ą║ ąĖč鹥čĆą░čåąĖčÅą╝ ą¤čĆąŠčåąĄčüčüąĮčŗą╣ ą╝ąĄąĮąĄą┤ąČą╝ąĄąĮčé ą£ą░ą╗ąĄąĮčīą║ąĖąĄ ą║ąŠą╝ą░ąĮą┤čŗ
- 7. ąĪą░ą╝ąŠčāą┐čĆą░ą▓ą╗čÅąĄą╝ą░čÅ ą║ąŠą╝ą░ąĮą┤ą░ čŹč鹊 ąĮąĄą▒ąŠą╗čīčłą░čÅ ą│čĆčāą┐ą┐ą░ ą╗čÄą┤ąĄą╣ čü ą┤ąŠą┐ąŠą╗ąĮčÅčÄčēąĖą╝ąĖ ąĮą░ą▓čŗą║ą░ą╝ąĖ, čü ąŠą▒čēąĄą╣ čåąĄą╗čīčÄ, čüčéčĆąĄą╝čÅčēą░čÅčüčÅ čāą╗čāčćčłąĖčéčī čüą▓ąŠčÄ ą┐čĆąŠąĖąĘą▓ąŠą┤ąĖč鹥ą╗čīąĮąŠčüčéčī ąĖ čćčāą▓čüčéą▓čāčÄčēą░čÅ ąŠčéą▓ąĄčéčüčéą▓ąĄąĮąĮąŠčüčéčī ą┐ąŠ ąŠčéąĮąŠčłąĄąĮąĖčÄ ą║ ą┤čĆčāą│ ą┤čĆčāą│čāŌĆ”
- 8. Rational Unified Process (RUP) ąÆ ąŠčüąĮąŠą▓ąĄ RUP ą╗ąĄąČą░čé čüą╗ąĄą┤čāčÄčēąĖąĄ ą┐čĆąĖąĮčåąĖą┐čŗ: ąĀą░ąĮąĮčÅčÅ ąĖą┤ąĄąĮčéąĖčäąĖą║ą░čåąĖčÅ ąĖ ąĮąĄą┐čĆąĄčĆčŗą▓ąĮąŠąĄ (ą┤ąŠ ąŠą║ąŠąĮčćą░ąĮąĖčÅ ą┐čĆąŠąĄą║čéą░) čāčüčéčĆą░ąĮąĄąĮąĖąĄ ąŠčüąĮąŠą▓ąĮčŗčģ čĆąĖčüą║ąŠą▓. ąÜąŠąĮčåąĄąĮčéčĆą░čåąĖčÅ ąĮą░ ą▓čŗą┐ąŠą╗ąĮąĄąĮąĖąĖ čéčĆąĄą▒ąŠą▓ą░ąĮąĖą╣ ąĘą░ą║ą░ąĘčćąĖą║ąŠą▓ ą║ ąĖčüą┐ąŠą╗ąĮčÅąĄą╝ąŠą╣ ą┐čĆąŠą│čĆą░ą╝ą╝ąĄ (ą░ąĮą░ą╗ąĖąĘ ąĖ ą┐ąŠčüčéčĆąŠąĄąĮąĖąĄ ą╝ąŠą┤ąĄą╗ąĖ ą┐čĆąĄčåąĄą┤ąĄąĮč鹊ą▓ (ą▓ą░čĆąĖą░ąĮč鹊ą▓ ąĖčüą┐ąŠą╗čīąĘąŠą▓ą░ąĮąĖčÅ)). ą×ąČąĖą┤ą░ąĮąĖąĄ ąĖąĘą╝ąĄąĮąĄąĮąĖą╣ ą▓ čéčĆąĄą▒ąŠą▓ą░ąĮąĖčÅčģ, ą┐čĆąŠąĄą║čéąĮčŗčģ čĆąĄčłąĄąĮąĖčÅčģ ąĖ čĆąĄą░ą╗ąĖąĘą░čåąĖąĖ ą▓ ą┐čĆąŠčåąĄčüčüąĄ čĆą░ąĘčĆą░ą▒ąŠčéą║ąĖ. ąÜąŠą╝ą┐ąŠąĮąĄąĮčéąĮą░čÅ ą░čĆčģąĖč鹥ą║čéčāčĆą░, čĆąĄą░ą╗ąĖąĘčāąĄą╝ą░čÅ ąĖ č鹥čüčéąĖčĆčāąĄą╝ą░čÅ ąĮą░ čĆą░ąĮąĮąĖčģ čüčéą░ą┤ąĖčÅčģ ą┐čĆąŠąĄą║čéą░. ą¤ąŠčüč鹊čÅąĮąĮąŠąĄ ąŠą▒ąĄčüą┐ąĄč湥ąĮąĖąĄ ą║ą░č湥čüčéą▓ą░ ąĮą░ ą▓čüąĄčģ čŹčéą░ą┐ą░čģ čĆą░ąĘčĆą░ą▒ąŠčéą║ąĖ ą┐čĆąŠąĄą║čéą░ (ą┐čĆąŠą┤čāą║čéą░). ąĀą░ą▒ąŠčéą░ ąĮą░ą┤ ą┐čĆąŠąĄą║č鹊ą╝ ą▓ čüą┐ą╗ąŠčćčæąĮąĮąŠą╣ ą║ąŠą╝ą░ąĮą┤ąĄ, ą║ą╗čÄč湥ą▓ą░čÅ čĆąŠą╗čī ą▓ ą║ąŠč鹊čĆąŠą╣ ą┐čĆąĖąĮą░ą┤ą╗ąĄąČąĖčé ą░čĆčģąĖč鹥ą║č鹊čĆą░ą╝.
- 10. ąĪčéą░čéąĖč湥čüą║ą░čÅ čüčéčĆčāą║čéčāčĆą░ RUP╠² ąöą╗čÅ╠²ąŠą┐ąĖčüą░ąĮąĖčÅ ąŠčüą╝čŗčüą╗ąĄąĮąĮąŠą╣ ą┐ąŠčüą╗ąĄą┤ąŠą▓ą░č鹥ą╗čīąĮąŠčüčéąĖ ą▓čŗą┐ąŠą╗ąĮąĄąĮąĖčÅ čĆą░ą▒ąŠčé ąĖ╠²ąĘą░ą┤ą░čć ąĖčüą┐ąŠą╗čīąĘčāčÄčéčüčÅ čĆą░ą▒ąŠčćąĖąĄ ą┐čĆąŠčåąĄčüčüčŗ. ą×ąĮąĖ╠²ąŠą┐ąĖčüčŗą▓ą░čÄčé ą║č鹊, čćč鹊, ą║ą░ą║╠²ąĖ╠²ą║ąŠą│ą┤ą░ ą▓čŗą┐ąŠą╗ąĮčÅąĄčé ą▓╠²ą┐čĆąŠčåąĄčüčüąĄ. ąÆ╠²RUP╠²ą▓čģąŠą┤čÅčé 6╠²ąŠčüąĮąŠą▓ąĮčŗčģ ą┤ąĖčüčåąĖą┐ą╗ąĖąĮ: ŌĆö ąæąĖąĘąĮąĄčü-ą╝ąŠą┤ąĄą╗ąĖčĆąŠą▓ą░ąĮąĖąĄ (Business modeling); ŌĆö ąŻą┐čĆą░ą▓ą╗ąĄąĮąĖąĄ čéčĆąĄą▒ąŠą▓ą░ąĮąĖčÅą╝ąĖ (Requirements); ŌĆö ąÉąĮą░ą╗ąĖąĘ ąĖ╠²ą¤čĆąŠąĄą║čéąĖčĆąŠą▓ą░ąĮąĖąĄ (Analysis and╠²Design); ŌĆö ąĀąĄą░ą╗ąĖąĘą░čåąĖčÅ (Implementation); ŌĆö ąóąĄčüčéąĖčĆąŠą▓ą░ąĮąĖąĄ (Test); ŌĆö ąĀą░ąĘą▓ąĄčĆčéčŗą▓ą░ąĮąĖąĄ (Deployment). ąś╠²čéčĆąĖ╠²ą▓čüą┐ąŠą╝ąŠą│ą░č鹥ą╗čīąĮčŗąĄ: ŌĆö ąŻą┐čĆą░ą▓ą╗ąĄąĮąĖąĄ ą┐čĆąŠąĄą║č鹊ą╝ (Project management); ŌĆö ąŻą┐čĆą░ą▓ą╗ąĄąĮąĖąĄ ąĖąĘą╝ąĄąĮąĄąĮąĖčÅą╝ąĖ (Change management); ŌĆö ąĪčĆąĄą┤ą░ (Environment).
- 11. ąŁčéą░ą┐ ą┐čĆąŠąĄą║čéąĖčĆąŠą▓ą░ąĮąĖčÅ ą▓ RUP ąØą░ čŹčéą░ą┐ąĄ ą┐čĆąŠąĄą║čéąĖčĆąŠą▓ą░ąĮąĖčÅ ą┐čĆąŠąĖąĘą▓ąŠą┤ąĖčéčüčÅ ą░ąĮą░ą╗ąĖąĘ ą┐čĆąĄą┤ą╝ąĄčéąĮąŠą╣ ąŠą▒ą╗ą░čüčéąĖ ąĖ ą┐ąŠčüčéčĆąŠąĄąĮąĖąĄ ąĖčüą┐ąŠą╗ąĮčÅąĄą╝ąŠą╣ ą░čĆčģąĖč鹥ą║čéčāčĆčŗ. ąŁč鹊 ą▓ą║ą╗čÄčćą░ąĄčé ą▓ čüąĄą▒čÅ: ąöąŠą║čāą╝ąĄąĮčéąĖčĆąŠą▓ą░ąĮąĖąĄ čéčĆąĄą▒ąŠą▓ą░ąĮąĖą╣ (ą▓ą║ą╗čÄčćą░čÅ ą┤ąĄčéą░ą╗čīąĮąŠąĄ ąŠą┐ąĖčüą░ąĮąĖąĄ ą┤ą╗čÅ ą▒ąŠą╗čīčłąĖąĮčüčéą▓ą░ ą┐čĆąĄčåąĄą┤ąĄąĮč鹊ą▓). ąĪą┐čĆąŠąĄą║čéąĖčĆąŠą▓ą░ąĮąĮčāčÄ, čĆąĄą░ą╗ąĖąĘąŠą▓ą░ąĮąĮčāčÄ ąĖ ąŠčéč鹥čüčéąĖčĆąŠą▓ą░ąĮąĮčāčÄ ąĖčüą┐ąŠą╗ąĮčÅąĄą╝čāčÄ ą░čĆčģąĖč鹥ą║čéčāčĆčā. ą×ą▒ąĮąŠą▓ą╗ąĄąĮąĮąŠąĄ 菹║ąŠąĮąŠą╝ąĖč湥čüą║ąŠąĄ ąŠą▒ąŠčüąĮąŠą▓ą░ąĮąĖąĄ ąĖ ą▒ąŠą╗ąĄąĄ č鹊čćąĮčŗąĄ ąŠčåąĄąĮą║ąĖ čüčĆąŠą║ąŠą▓ ąĖ čüč鹊ąĖą╝ąŠčüčéąĖ. ąĪąĮąĖąČąĄąĮąĮčŗąĄ ąŠčüąĮąŠą▓ąĮčŗąĄ čĆąĖčüą║ąĖ.
- 12. Agile, Scrum (1) ąŻą┤ąŠą▓ą╗ąĄčéą▓ąŠčĆąĄąĮąĖąĄ ą║ą╗ąĖąĄąĮčéą░ ąĘą░ čüčćčæčé čĆą░ąĮąĮąĄą╣ ąĖ ą▒ąĄčüą┐ąĄčĆąĄą▒ąŠą╣ąĮąŠą╣ ą┐ąŠčüčéą░ą▓ą║ąĖ čåąĄąĮąĮąŠą│ąŠ ą¤ą× ą¤čĆąĖą▓ąĄčéčüčéą▓ąĖąĄ ąĖąĘą╝ąĄąĮąĄąĮąĖčÅ čéčĆąĄą▒ąŠą▓ą░ąĮąĖą╣, ą┤ą░ąČąĄ ą▓ ą║ąŠąĮčåąĄ čĆą░ąĘčĆą░ą▒ąŠčéą║ąĖ. ąŁč鹊 ą╝ąŠąČąĄčé ą┐ąŠą▓čŗčüąĖčéčī ą║ąŠąĮą║čāčĆąĄąĮč鹊čüą┐ąŠčüąŠą▒ąĮąŠčüčéčī ą┐ąŠą╗čāč湥ąĮąĮąŠą│ąŠ ą┐čĆąŠą┤čāą║čéą░ ą¦ą░čüčéą░čÅ ą┐ąŠčüčéą░ą▓ą║ą░ čĆą░ą▒ąŠč湥ą│ąŠ ą¤ą× (ą║ą░ąČą┤čŗą╣ ą╝ąĄčüčÅčå ąĖą╗ąĖ ąĮąĄą┤ąĄą╗čÄ ąĖą╗ąĖ ąĄčēčæ čćą░čēąĄ) ąóąĄčüąĮąŠąĄ, ąĄąČąĄą┤ąĮąĄą▓ąĮąŠąĄ ąŠą▒čēąĄąĮąĖąĄ ąĘą░ą║ą░ąĘčćąĖą║ą░ čü čĆą░ąĘčĆą░ą▒ąŠčéčćąĖą║ą░ą╝ąĖ ąĮą░ ą┐čĆąŠčéčÅąČąĄąĮąĖąĖ ą▓čüąĄą│ąŠ ą┐čĆąŠąĄą║čéą░ ą¤čĆąŠąĄą║č鹊ą╝ ąĘą░ąĮąĖą╝ą░čÄčéčüčÅ ą╝ąŠčéąĖą▓ąĖčĆąŠą▓ą░ąĮąĮčŗąĄ ą╗ąĖčćąĮąŠčüčéąĖ, ą║ąŠč鹊čĆčŗąĄ ąŠą▒ąĄčüą┐ąĄč湥ąĮčŗ ąĮčāąČąĮčŗą╝ąĖ čāčüą╗ąŠą▓ąĖčÅą╝ąĖ čĆą░ą▒ąŠčéčŗ, ą┐ąŠą┤ą┤ąĄčƹȹ║ąŠą╣ ąĖ ą┤ąŠą▓ąĄčĆąĖąĄą╝. ąĀąĄą║ąŠą╝ąĄąĮą┤čāąĄą╝čŗą╣ ą╝ąĄč鹊ą┤ ą┐ąĄčĆąĄą┤ą░čćąĖ ąĖąĮč乊čĆą╝ą░čåąĖąĖ čŹč鹊 ą╗ąĖčćąĮčŗą╣ čĆą░ąĘą│ąŠą▓ąŠčĆ (ą╗ąĖčåąŠą╝ ą║ ą╗ąĖčåčā)
- 13. Agile, Scrum (2) ąĀą░ą▒ąŠčéą░čÄčēąĄąĄ ą¤ą×╠²ŌĆö ą╗čāčćčłąĖą╣ ąĖąĘą╝ąĄčĆąĖč鹥ą╗čī ą┐čĆąŠą│čĆąĄčüčüą░ ąĪą┐ąŠąĮčüąŠčĆčŗ, čĆą░ąĘčĆą░ą▒ąŠčéčćąĖą║ąĖ ąĖ ą┐ąŠą╗čīąĘąŠą▓ą░č鹥ą╗ąĖ ą┤ąŠą╗ąČąĮčŗ ąĖą╝ąĄčéčī ą▓ąŠąĘą╝ąŠąČąĮąŠčüčéčī ą┐ąŠą┤ą┤ąĄčƹȹĖą▓ą░čéčī ą┐ąŠčüč鹊čÅąĮąĮčŗą╣ č鹥ą╝ą┐ ąĮą░ ąĮąĄąŠą┐čĆąĄą┤ąĄą╗ąĄąĮąĮčŗą╣ čüčĆąŠą║ ą¤ąŠčüč鹊čÅąĮąĮąŠąĄ ą▓ąĮąĖą╝ą░ąĮąĖąĄ ąĮą░ čāą╗čāčćčłąĄąĮąĖąĄ č鹥čģąĮąĖč湥čüą║ąŠą│ąŠ ą╝ą░čüč鹥čĆčüčéą▓ą░ ąĖ čāą┤ąŠą▒ąĮčŗą╣ ą┤ąĖąĘą░ą╣ąĮ ą¤čĆąŠčüč鹊čéą░╠²ŌĆö ąĖčüą║čāčüčüčéą▓ąŠ ąØąĢ ą┤ąĄą╗ą░čéčī ą╗ąĖčłąĮąĄą╣ čĆą░ą▒ąŠčéčŗ ąøčāčćčłąĖąĄ ą░čĆčģąĖč鹥ą║čéčāčĆą░, čéčĆąĄą▒ąŠą▓ą░ąĮąĖčÅ ąĖ ą┤ąĖąĘą░ą╣ąĮ ą┐ąŠą╗čāčćą░čÄčéčüčÅ čā čüą░ą╝ąŠąŠčĆą│ą░ąĮąĖąĘąŠą▓ą░ąĮąĮąŠą╣ ą║ąŠą╝ą░ąĮą┤čŗ ą¤ąŠčüč鹊čÅąĮąĮą░čÅ(ą¦ą░čüčéą░čÅ) ą░ą┤ą░ą┐čéą░čåąĖčÅ(čāą╗čāčćčłąĄąĮąĖąĄ čŹčäč乥ą║čéąĖą▓ąĮąŠčüčéąĖ čĆą░ą▒ąŠčéčŗ) ą║ ąĖąĘą╝ąĄąĮčÅčÄčēąĖą╝čüčÅ ąŠą▒čüč鹊čÅč鹥ą╗čīčüčéą▓ą░ą╝
- 14. ╠²
- 15. ąöą▓ąĄąĮą░ą┤čåą░čéčī ąŠčüąĮąŠą▓ąĮčŗčģ ą┐čĆąĖčæą╝ąŠą▓ XP (1) ąÜąŠčĆąŠčéą║ąĖą╣ čåąĖą║ą╗ ąŠą▒čĆą░čéąĮąŠą╣ čüą▓čÅąĘąĖ ( Fine scale feedback) ąĀą░ąĘčĆą░ą▒ąŠčéą║ą░ č湥čĆąĄąĘ č鹥čüčéąĖčĆąŠą▓ą░ąĮąĖąĄ ( Test driven development) ąśą│čĆą░ ą▓ ą┐ą╗ą░ąĮąĖčĆąŠą▓ą░ąĮąĖąĄ ( Planning game) ąŚą░ą║ą░ąĘčćąĖą║ ą▓čüąĄą│ą┤ą░ čĆčÅą┤ąŠą╝ ( Whole team, Onsite customer) ą¤ą░čĆąĮąŠąĄ ą┐čĆąŠą│čĆą░ą╝ą╝ąĖčĆąŠą▓ą░ąĮąĖąĄ ( Pair programming) ąØąĄą┐čĆąĄčĆčŗą▓ąĮčŗą╣, ą░ ąĮąĄ ą┐ą░ą║ąĄčéąĮčŗą╣ ą┐čĆąŠčåąĄčüčü ąØąĄą┐čĆąĄčĆčŗą▓ąĮą░čÅ ąĖąĮč鹥ą│čĆą░čåąĖčÅ ( Continuous Integration) ąĀąĄčäą░ą║č鹊čĆąĖąĮą│ ( Design Improvement, Refactor) ą¦ą░čüčéčŗąĄ ąĮąĄą▒ąŠą╗čīčłąĖąĄ čĆąĄą╗ąĖąĘčŗ ( Small Releases)
- 16. ąöą▓ąĄąĮą░ą┤čåą░čéčī ąŠčüąĮąŠą▓ąĮčŗčģ ą┐čĆąĖčæą╝ąŠą▓ XP (2) ą¤ąŠąĮąĖą╝ą░ąĮąĖąĄ, čĆą░ąĘą┤ąĄą╗čÅąĄą╝ąŠąĄ ą▓čüąĄą╝ąĖ ą¤čĆąŠčüč鹊čéą░ ( Simple design) ą£ąĄčéą░č乊čĆą░ čüąĖčüč鹥ą╝čŗ ( System metaphor) ąÜąŠą╗ą╗ąĄą║čéąĖą▓ąĮąŠąĄ ą▓ą╗ą░ą┤ąĄąĮąĖąĄ ą║ąŠą┤ąŠą╝ ( Collective code ownership) ąĖą╗ąĖ ą▓čŗą▒čĆą░ąĮąĮčŗą╝ąĖ čłą░ą▒ą╗ąŠąĮą░ą╝ąĖ ą┐čĆąŠąĄą║čéąĖčĆąŠą▓ą░ąĮąĖčÅ ( Collective patterns ownership) ąĪčéą░ąĮą┤ą░čĆčé ą║ąŠą┤ąĖčĆąŠą▓ą░ąĮąĖčÅ ( Coding standard or Coding conventions) ąĪąŠčåąĖą░ą╗čīąĮą░čÅ ąĘą░čēąĖčēąĄąĮąĮąŠčüčéčī ą┐čĆąŠą│čĆą░ą╝ą╝ąĖčüčéą░ ( Programmer welfare): 40- čćą░čüąŠą▓ą░čÅ čĆą░ą▒ąŠčćą░čÅ ąĮąĄą┤ąĄą╗čÅ ( Sustainable pace, Forty hour week)
- 17. ╠²
- 18. ╠²
- 19. ą¤čĆąŠą▒ą╗ąĄą╝čŗ ┬½ą¤čĆąŠą│čĆą░ą╝ą╝ąĖčüčéčŗ ąĮąĄ č鹥čüčéąĖčĆčāčÄčé!┬╗ ┬½ąÉ čā ą╝ąĄąĮčÅ ąĮą░ ą╝ą░čłąĖąĮąĄ ą▓čüčæ čĆą░ą▒ąŠčéą░ąĄčé!┬╗ ┬½ąØą░čüč鹊čÅčēąĖą╣ ą╝čāąČąĖą║ čüą▓ąŠąĖ ą┐čĆąŠą▒ą╗ąĄą╝čŗ čĆąĄčłą░ąĄčé čüą░ą╝!┬╗ ą¤čĆąŠą▒ą╗ąĄą╝ą░ ąŠčéą▓ąĄčéčüčéą▓ąĄąĮąĮąŠčüčéąĖ ą¤čĆąŠą▒ą╗ąĄą╝ą░ ą┐čĆąŠąĘčĆą░čćąĮąŠčüčéąĖ
- 20. ą¦ąĄą╝ čĆą░ąĮčīčłąĄ ąĮą░čģąŠą┤ąĖčéčüčÅ ąŠčłąĖą▒ą║ą░, č鹥ą╝ ąŠąĮą░ ą┤ąĄčłąĄą▓ą╗ąĄ ąŠą▒čģąŠą┤ąĖčéčüčÅ ą¤ą░čĆąĮąŠąĄ ą┐čĆąŠą│čĆą░ą╝ą╝ąĖčĆąŠą▓ą░ąĮąĖąĄ ąĀąĄą▓čīčÄ ą║ąŠą┤ą░ ą┤ąŠ ą║ąŠą╝ą╝ąĖčéą░ ąĀąĄčäą░ą║č鹊čĆąĖąĮą│
- 21. ąśčüą┐čĆą░ą▓ą╗ąĄąĮąĖąĄ ąŠčłąĖą▒ąŠą║ ąĖ ą░ą▓č鹊ą╝ą░čéąĖąĘą░čåąĖčÅ ąØąĄą┐čĆąĄčĆčŗą▓ąĮą░čÅ ąĖąĮč鹥ą│čĆą░čåąĖčÅ ą«ąĮąĖčé-č鹥čüčéčŗ ąĀą░ąĘčĆą░ą▒ąŠčéą║ą░ č湥čĆąĄąĘ č鹥čüčéąĖčĆąŠą▓ą░ąĮąĖąĄ ( TDD) ąÉą▓č鹊ą╝ą░čéąĖąĘąĖčĆąŠ- ą▓ą░ąĮąĮąŠąĄ ą┐čĆąĖčæą╝ąŠčćąĮąŠąĄ č鹥čüčéąĖčĆąŠą▓ą░ąĮąĖąĄ
- 22. ą¤čĆąŠą▒ą╗ąĄą╝čŗ čāą┐čĆą░ą▓ą╗ąĄąĮąĖčÅ ą║ą░č湥čüčéą▓ąŠą╝ ą▓ Agile ąØąĄą┤ąŠčüčéą░č鹊ą║ ą╝ąŠčéąĖą▓ą░čåąĖąĖ ąØąĄą┤ąŠčüčéą░č鹊ą║ ą┤ąĖčüčåąĖą┐ą╗ąĖąĮčŗ ąŻąĮą░čüą╗ąĄą┤ąŠą▓ą░ąĮąĮčŗą╣ ą║ąŠą┤ ŌĆ”
- 23. ąśąĮčüčéčĆčāą╝ąĄąĮčéą░čĆąĖą╣ Definition of Done - ą¦č鹊 ąĘąĮą░čćąĖčé ┬½ąōą×ąóą×ąÆą×┬╗? ąöąŠčüą║ą░ ąóąĄčģąĮąĖč湥čüą║ąĖą╣ ą┤ąŠą╗ą│ Daily scrum, product backlog, ąĮąĄčé ąĮą░ąĘąĮą░č湥ąĮąĖą╣
- 24. ąĪą┐ą░čüąĖą▒ąŠ ąĘą░ ą▓ąĮąĖą╝ą░ąĮąĖąĄ! ŌĆ£ Getting RealŌĆØ, 37signals ążčĆąĄą┤ąĄčĆąĖą║ ąæčĆčāą║čü ┬½ą£ąĖčäąĖč湥čüą║ąĖą╣ č湥ą╗ąŠą▓ąĄą║ąŠ-ą╝ąĄčüčÅčå ąĖą╗ąĖ ąÜą░ą║ čüąŠąĘą┤ą░čÄčéčüčÅ ą┐čĆąŠą│čĆą░ą╝ą╝ąĮčŗąĄ čüąĖčüč鹥ą╝čŗ┬╗ ąóąŠą╝ ąöąĄą╝ą░čĆą║ąŠ ąĖ ąóąĖą╝ąŠčéąĖ ąøąĖčüč鹥čĆ ┬½ą¦ąĄą╗ąŠą▓ąĄč湥čüą║ąĖą╣ čäą░ą║č鹊čĆ. ąŻčüą┐ąĄčłąĮčŗąĄ ą┐čĆąŠąĄą║čéčŗ ąĖ ą║ąŠą╝ą░ąĮą┤čŗ┬╗ ąöąČąŠ ą£ą░čĆą░čüą║ąŠ ┬½IT-ą┐čĆąŠąĄą║čéčŗ: čäčĆąŠąĮč鹊ą▓čŗąĄ ąŠč湥čĆą║ąĖ┬╗