Return-on-Investment Studies: Using Production Data in Technical Services
- 1. Beth Picknally Camden University of Pennsylvania Libraries bethpc@upenn.edu June 2014
- 2. ’üĮ Business definition ’üĮ Library approach ’üĮ My approach ŌŚ” Cost ŌŚ” Value
- 3. ’üĮ Fast-track replacements ’üĮ Serials check-in ’üĮ Returns
- 4. ’üĮ Fast-track replacement is a process where we purchase replacements for missing books before they are fully searched & declared lost. ’üĮ Reason for study: ŌŚ” time pressure; ŌĆ£nicheŌĆØ workflow ŌŚ” Staff reporting that many books were ŌĆ£foundŌĆØ by the time replacement arrived ŌŚ” Growth of BD/EZB seen as replacing the need
- 5. ’üĮ Costs ’üĮ Sample of 75 replacements over 3 FYs ’üĮ Circulation data ’üĮ Discussions with bibliographers
- 6. Total spent Number purchased Average cost FY08 $19,394.33 427 $45.42 FY09 $23,953.85 478 $50.11 FY10 $27,074.64 507 $53.40 Total 08-10 $70,422.82 1,412 $49.87
- 7. Sample size Still lost? % Aver circ orig copy Aver circ repl copy Aver circ BD/EZB FY08 25 14 56.0% 5.12 2.64 0.68 FY09 25 12 48.0% 3.64 0.96 2.4 FY10 25 13 52.0% 3.04 1.44 0.16 Overall 75 40 53.3% 3.93 1.68 1.08
- 8. ’üĮ CouldnŌĆÖt get report with all the factors that I wanted to consider ’üĮ So used sample for a deep dive ŌŚ” Voyager searching ŌŚ” BD/EZB reports
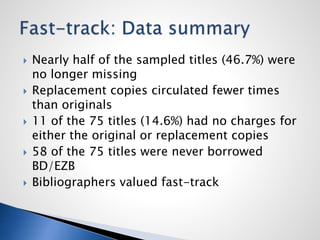
- 9. ’üĮ Nearly half of the sampled titles (46.7%) were no longer missing ’üĮ Replacement copies circulated fewer times than originals ’üĮ 11 of the 75 titles (14.6%) had no charges for either the original or replacement copies ’üĮ 58 of the 75 titles were never borrowed BD/EZB ’üĮ Bibliographers valued fast-track
- 10. ’üĮ Continue Fast-track ’üĮ Change in timing (now biweekly) ’üĮ Considering another review
- 11. ’üĮ Is periodical check-in worth the cost (staff time, etc.)?
- 12. ’üĮ Cost ’üĮ Staff interviews ’üĮ Patron point-of-use survey ’üĮ Tracking patron questions
- 13. Total salaries $ 77,216.00 current periodicals (est.) 5500 Annual cost per title $ 14.04 FY11 collection spending Monograph: $ 3,686,338.19 24.82% Serial: $ 1,507,453.46 10.15% Electronic: $ 9,031,362.90 60.80% General funds: $ 629,180.47 4.24%
- 14. ’üĮ 2 minute paper survey ’üĮ The survey results indicated: ŌŚ” Users found issues they needed on the shelves (71%) ŌŚ” Users consulted catalog first (64%) ŌŚ” If not found: they equally either ask for help, request an ILL, or use the online version
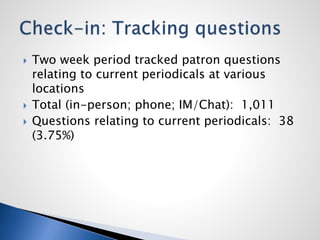
- 15. ’üĮ Two week period tracked patron questions relating to current periodicals at various locations ’üĮ Total (in-person; phone; IM/Chat): 1,011 ’üĮ Questions relating to current periodicals: 38 (3.75%)
- 16. ’üĮ Value of check-in ŌŚ” Collection integrity ŌŚ” Fiscal responsibility ŌŚ” Competence and service quality ŌŚ” Vendor reliability and accountability ’üĮ Also gathered info about current WF problems
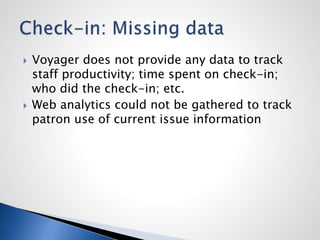
- 17. ’üĮ Voyager does not provide any data to track staff productivity; time spent on check-in; who did the check-in; etc. ’üĮ Web analytics could not be gathered to track patron use of current issue information
- 18. ’üĮ Report recommended continuing check-in ŌŚ” Deciding factor: fiscal responsibility ’üĮ Appendix documented a variety of workflow and timeliness problems. Many have been addressed.
- 19. This study looked at activity of returning books to vendors, for both approval plans and firm orders, and included a review of related activities including bibliographer review of approval books.
- 20. ’üĮ Departmental annual reports ’üĮ Voyager reports ’üĮ YBP GOBI reports
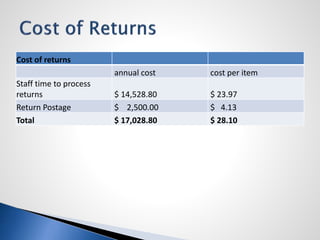
- 21. Cost of returns annual cost cost per item Staff time to process returns $ 14,528.80 $ 23.97 Return Postage $ 2,500.00 $ 4.13 Total $ 17,028.80 $ 28.10
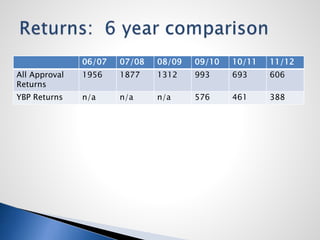
- 22. ’üĮ 30+ approval plans ’üĮ 3 years of data: ŌŚ” Number received (up slightly over 3 years) ŌŚ” Number returned (declining over 3 years) ŌŚ” Calculated % returned for each vendor ’üĮ Overall return rate declining 4%’āĀ2%
- 23. 06/07 07/08 08/09 09/10 10/11 11/12 All Approval Returns 1956 1877 1312 993 693 606 YBP Returns n/a n/a n/a 576 461 388
- 24. Approval Return Reasons damaged/defective 40 2% duplicate 564 29% no to series 13 1% poor quality 21 1% reprint 12 1% scope 656 34% textbook 3 0% too expensive 56 3% vendor error 1 0% wrong format 2 0% no reason 563 29%
- 25. LC Class Shipped Returned % Ret'd A 12 0 0% B 1828 21 1% C 84 0 0% D 1299 6 0% E 637 1 0% F 374 1 0% G 449 28 6% H 2937 36 1% J 970 5 1% K 460 54 12% L 551 5 1% LC Class Shipped Returned % Ret'd M 335 0 0% N 664 11 2% P 3839 12 0% Q 460 76 17% R 184 14 8% S 55 2 4% T 357 55 15% U 183 27 15% V 35 5 14% Z 47 1 2% Total 15760 360 2%
- 26. ’üĮ Eliminated plan with high rate of return ’üĮ Shared data with Coll Dev for updating profiles ’üĮ Not returning books costing $25 or less ’üĮ Used data (reduction in returns) to justify changing staff duties to union
- 27. ’üĮ Time consuming ’üĮ Not all data available ’üĮ Unexpected findings about related WF ’üĮ Assumptions may/may not be proven ’üĮ Other factors beyond data can influence decisions ’üĮ Determining the VALUE of a service is more difficult than determining the COST
- 28. Driving With Data: A Roadmap for Evidence-Based Decision Making in Academic Libraries ŌĆō Marcum & Schonfeld
Editor's Notes
- #3: Business definition (real money): ŌĆ£Some people think ROI is only calculated in financial terms, but it more broadly refers to any positive or negative business outcomes that are the result of making a particular investment. The╠²"return"╠²might be measured by progress toward goals, positive impact on intangible assets, increased competence, improved morale, employee or partner satisfaction, and other non-financial benefits. Costs can be calculated in both financial terms and in non-financial terms such as risk or impact on intangible assets and resources.ŌĆØ http://www.valuenetworksandcollaboration.com/advanced/tipsforcostbenefit.html Library ROI: -Public libraries: economic impact in a given community of library budget ŌĆ£In the study of Florida public libraries, a total of 17 public libraries were analyzed to assess the benefits to adult users who were 18 years of age or older; this study also considered the economic impact on these users....The analysis showed that approximately $6.40 of the total value per $1 of the budget was created. ŌĆ£ http://www.ala.org/research/librariesmatter/taxonomy/term/129 -Academic libraries: focusing on student/researcher impact Value of Academic Libraries Toolkit http://www.ala.org/acrl/issues/value/valueofacademiclibrariestoolkit#Academic%20Library%20ROI My approach -Investment=Cost (Salaries; Collection $; Shipping; supplies; other) -Return=Value -Internal: impact on other WF; impact on other depts -External: User impactŌĆödirect/indirect Value is the hardest to measure
- #5: 2011
- #7: Key: the collection cost was small as % of budget
- #9: Time consuming ŌĆō especially for BD/EZB
- #10: So, BD.EZB assumption was not true Bibliographers valued fast-track (low cost; no decision needed; not subject funds)
- #11: Single person study Took a lot of time Decision to use group for next study
- #12: Late 2011 ŌĆ£PetŌĆØ project of the library director
- #14: Note: Voyager can give us a count of subscriptions, but not a count of just periodical subscriptions which are currently received. Serials budget includes all print serials (not just periodicals) and print+online NOT MUCH DATA
- #15: distributed near the current periodicals area in 20 locations; 2 week period; 39 returned; chiefly from 3 locations ADD QUESTIONS -results were small and somewhat skewed by a larger number of returns from one small library -one key point: 64% claimed to check catalog firstŌĆöUSER VALUE of check-in information in the catalog
- #16: Very small % but PS staff give a strong emphasis on using check-in records to answer questions: ŌĆ£answer with authorityŌĆØ
- #17: Collection integrityŌĆöwe wonŌĆÖt know what we own; we wonŌĆÖt be able to claim Fiscal responsibilityŌĆöaudit trail; we prepay; if no check in no records of univ assets Service ŌĆōspeaking with authority about whether we have an issue
- #18: Classic vs New Franklin
- #19: Group process for this study did not work well -less open to change than we would like Director not happy with result -we will revisit at some point
- #20: Approach ŌĆō small group of 2 2012/13
- #21: Tons of data availableŌĆöLots of funs to dig into it!
- #22: FY12 costs
- #23: One vendor with a 16% return rate ŌĆō plan was cancelled even before we finished the study Huge table with each vendor over 3 years
- #24: From dept annual reports
- #25: Voyager report (3 FYs)ŌĆönote does not include all returns (we donŌĆÖt add records for all approvals at the point of receipt); so not included in this table No reason: YBP has discontinued slips with reason for return; so more recent returns do not have a reason Dupl: w/ diff. plan; w/ e-resource; w/ firm order; w/ gift; w/ standing order Scope: language; narrow geog.; out of scope; peripheral interest; too specialized; sufficient coverage; too narrow; too popular; wrong level Both Dupl & Scope point to the need for better awareness of app profiles
- #26: From YBP report ŌĆō FY12 Although the overall return rate is low at 2%, several of the LC classes show a high rate of return, including several in the double-digits (K, Q, T, U, and V). To clarify the picture further, we looked at returns rates by subclass. 22 subclasses had a return rate of 25% or higher; several subclasses had a 100% return rate (chiefly in K). An additional 18 subclasses had return rates of 10-14%. These subclasses should be reviewed by bibliographers to consider moving to the YBP slip plan. This would further reduce the number of returns. In general, small numbers in a subject area lend to a higher return rate. Also note that the classes with 0-1% are clear candidates for shelf ready (currently only Literature is shelf ready)
- #27: -considering moving to $50 cost as the cut off for returns -path for position elimination not clear

