[Week3] clean & correct data with OpenRefine
11 likes1,451 views

ĻĄ¼ĻĖĆ ņśżĒöłļ”¼ĒīīņØĖ(openrefine)ņØä ĒåĄĒĢ£ ļŹ░ņØ┤Ēä░ ņĀĢņĀ£ https://www.facebook.com/datadesigner2015


![OpenRefine
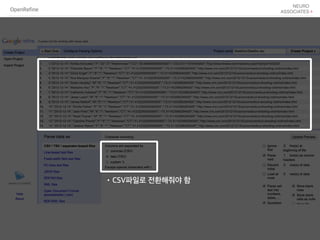
ŌĆóCity - Edit cells - transform
ŌĆóvalue + ŌĆ£,ŌĆØ + cells[ŌĆ£stateŌĆØ].value](https://image.slidesharecdn.com/week3cleancorrectdata-150124002827-conversion-gate02/85/Week3-clean-correct-data-with-OpenRefine-39-320.jpg)


[Week3] clean & correct data with OpenRefine
- 2. Chapter1 Getting started with OpenRefine OpenRefine
- 3. 1 Diving into OpenRefine OpenRefine
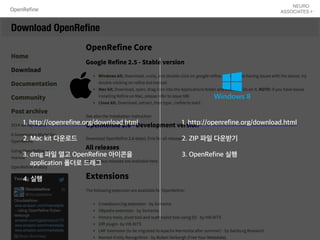
- 4. OpenRefine 1. http://openrefine.org/download.html 1. http://openrefine.org/download.html 2. Mac kit ļŗżņÜ┤ļĪ£ļō£ 3. dmg ĒīīņØ╝ ņŚ┤Ļ│Ā OpenRefine ņĢäņØ┤ņĮśņØä application ĒÅ┤ļŹöļĪ£ ļō£ļלĻĘĖ 4. ņŗżĒ¢ē 2. ZIP ĒīīņØ╝ ļŗżņÜ┤ļ░øĻĖ░ 3. OpenRefine ņŗżĒ¢ē
- 5. OpenRefine OpenRefineņØĆ Google ChromeņŚÉņä£ļ¦ī ņŗżĒ¢ē Ļ░ĆļŖź Internet ExplorerņŚÉņä£ļŖö ņ×æļÅÖ X
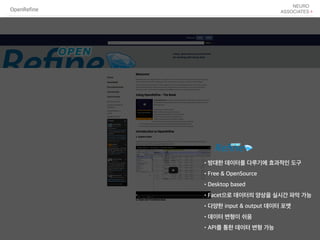
- 7. OpenRefine ŌĆóļ░®ļīĆĒĢ£ ļŹ░ņØ┤Ēä░ļź╝ ļŗżļŻ©ĻĖ░ņŚÉ ĒÜ©Ļ│╝ņĀüņØĖ ļÅäĻĄ¼ ŌĆóFree & OpenSource ŌĆóDesktop based ŌĆóFacetņ£╝ļĪ£ ļŹ░ņØ┤Ēä░ņØś ņ¢æņāüņØä ņŗżņŗ£Ļ░ä ĒīīņĢģ Ļ░ĆļŖź ŌĆóļŗżņ¢æĒĢ£ input & output ļŹ░ņØ┤Ēä░ Ēżļ¦Ę ŌĆóļŹ░ņØ┤Ēä░ ļ│ĆĒśĢņØ┤ ņē¼ņøĆ ŌĆóAPIļź╝ ĒåĄĒĢ£ ļŹ░ņØ┤Ēä░ ļ│ĆĒśĢ Ļ░ĆļŖź
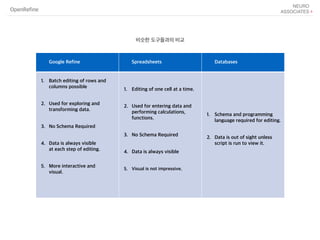
- 8. OpenRefine Google Refine Spreadsheets Databases 1. Batch editing of rows and columns possible ŌĆ© 2. Used for exploring and transforming data. ŌĆ© 3. No Schema Required ŌĆ© 4. Data is always visible ŌĆ© at each step of editing. ŌĆ© 5. More interactive and ŌĆ© visual. ŌĆ© 1. Editing of one cell at a time. ŌĆ© 2. Used for entering data and performing calculations, functions. ŌĆ© 3. No Schema Required ŌĆ© 4. Data is always visible ŌĆ© 5. Visual is not impressive. ŌĆ© 1. Schema and programming ŌĆ© language required for editing. ŌĆ© 2. Data is out of sight unless ŌĆ© script is run to view it. ŌĆ© ļ╣äņŖĘĒĢ£ ļÅäĻĄ¼ļōżĻ│╝ņØś ļ╣äĻĄÉ
- 9. OpenRefine 2.Creating & Setting a new project ņāłļĪ£ņÜ┤ ĒöäļĪ£ņĀØĒŖĖ ļ¦īļōżĻĖ░
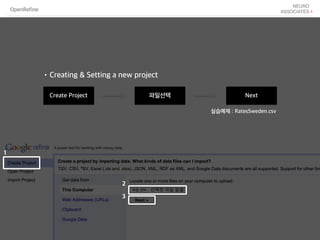
- 11. OpenRefine Create Project ĒīīņØ╝ņäĀĒāØ Next ŌĆóCreating & Setting a new project 1 2 3 ņŗżņŖĄņśłņĀ£ : RatesSweden.csv
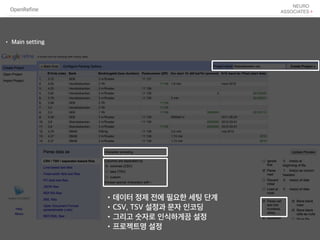
- 12. OpenRefine ŌĆóļŹ░ņØ┤Ēä░ ņĀĢņĀ£ ņĀäņŚÉ ĒĢäņÜöĒĢ£ ņäĖĒīģ ļŗ©Ļ│ä ŌĆóCSV, TSV ņäżņĀĢĻ│╝ ļ¼Ėņ×É ņØĖņĮöļö® ŌĆóĻĘĖļ”¼Ļ│Ā ņł½ņ×ÉļĪ£ ņØĖņŗØĒĢśĻ▓īļüö ņäżņĀĢ ŌĆóĒöäļĪ£ņĀØĒŖĖļ¬ģ ņäżņĀĢ ŌĆó Main setting
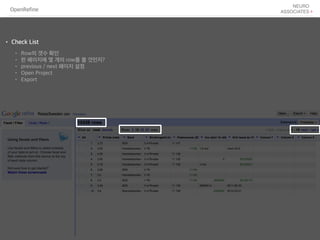
- 13. OpenRefine ŌĆó Check List ŌĆó RowņØś Ļ░»ņłś ĒÖĢņØĖ ŌĆó ĒĢ£ ĒÄśņØ┤ņ¦ĆņŚÉ ļ¬ć Ļ░£ņØś rowļź╝ ļ│╝ Ļ▓āņØĖņ¦Ć? ŌĆó previous / next ĒÄśņØ┤ņ¦Ć ņäżņĀĢ ŌĆó Open Project ŌĆó Export
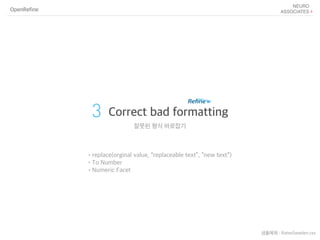
- 14. OpenRefine 3 Correct bad formatting ņלļ¬╗ļÉ£ ĒśĢņŗØ ļ░öļĪ£ņ×ĪĻĖ░ ŌĆóreplace(orginal value, ŌĆ£replaceable textŌĆØ, ŌĆ£new textŌĆØ) ŌĆóTo Number ŌĆóNumeric Facet ņāśĒöīņśłņĀ£ : RatesSweden.csv
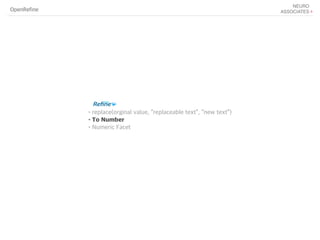
- 15. OpenRefine ŌĆóreplace(orginal value, ŌĆ£replaceable textŌĆØ, ŌĆ£new textŌĆØ) ŌĆóTo Number ŌĆóNumeric Facet
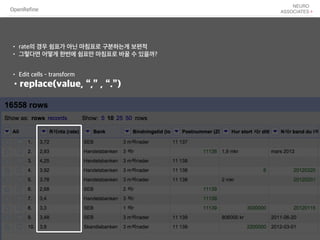
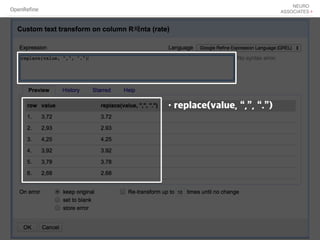
- 16. OpenRefine ŌĆó rateņØś Ļ▓ĮņÜ░ ņē╝Ēæ£Ļ░Ć ņĢäļŗī ļ¦łņ╣©Ēæ£ļĪ£ ĻĄ¼ļČäĒĢśļŖöĻ▓ī ļ│┤ĒÄĖņĀü ŌĆó ĻĘĖļĀćļŗżļ®┤ ņ¢┤ļ¢╗Ļ▓ī ĒĢ£ļ▓łņŚÉ ņē╝Ēæ£ļ¦ī ļ¦łņ╣©Ēæ£ļĪ£ ļ░öĻ┐Ć ņłś ņ׳ņØäĻ╣ī? ŌĆó Edit cells - transform ŌĆóreplace(value, ŌĆ£,ŌĆØ , ŌĆ£.ŌĆØ)
- 18. OpenRefine ŌĆóreplace(orginal value, ŌĆ£replaceable textŌĆØ, ŌĆ£new textŌĆØ) ŌĆóTo Number ŌĆóNumeric Facet
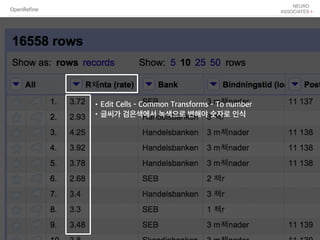
- 19. OpenRefine ŌĆóEdit Cells - Common Transforms - To number ŌĆóĻĖĆņö©Ļ░Ć Ļ▓ĆņØĆņāēņŚÉņä£ ļģ╣ņāēņ£╝ļĪ£ ļ│ĆĒĢ┤ņĢ╝ ņł½ņ×ÉļĪ£ ņØĖņŗØ
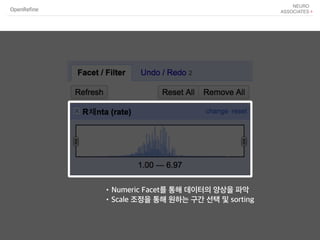
- 20. OpenRefine ŌĆóreplace(orginal value, ŌĆ£replaceable textŌĆØ, ŌĆ£new textŌĆØ) ŌĆóTo Number ŌĆóNumeric Facet
- 21. OpenRefine ŌĆóNumeric Facetļź╝ ĒåĄĒĢ┤ ļŹ░ņØ┤Ēä░ņØś ņ¢æņāüņØä ĒīīņĢģ ŌĆóScale ņĪ░ņĀĢņØä ĒåĄĒĢ┤ ņøÉĒĢśļŖö ĻĄ¼Ļ░ä ņäĀĒāØ ļ░Å sorting
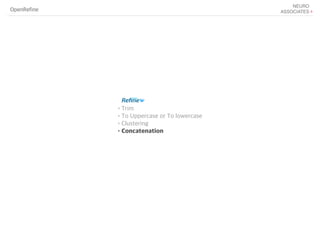
- 22. OpenRefine 4 Correct Misspellings ņלļ¬╗ļÉ£ ņśżļźś ļ░öļĪ£ņ×ĪĻĖ░ ŌĆóTrim ŌĆóTo Uppercase or To lowercase ŌĆóClustering ŌĆóMerge columns ņāśĒöīņśłņĀ£ : slategundeath.csv
- 23. OpenRefine ŌĆóTrim ŌĆóTo Uppercase or To lowercase ŌĆóClustering ŌĆóMerge columns
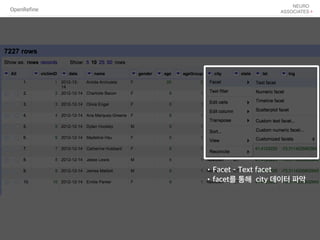
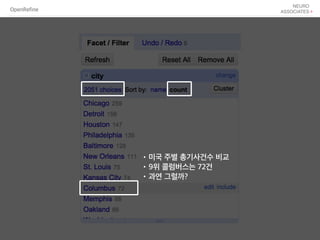
- 25. OpenRefine ŌĆóFacet - Text facet ŌĆófacetļź╝ ĒåĄĒĢ┤ city ļŹ░ņØ┤Ēä░ ĒīīņĢģ
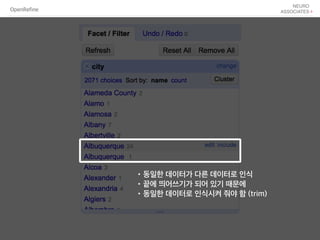
- 26. OpenRefine ŌĆóļÅÖņØ╝ĒĢ£ ļŹ░ņØ┤Ēä░Ļ░Ć ļŗżļźĖ ļŹ░ņØ┤Ēä░ļĪ£ ņØĖņŗØ ŌĆóļüØņŚÉ ļØäņ¢┤ņō░ĻĖ░Ļ░Ć ļÉśņ¢┤ ņ׳ĻĖ░ ļĢīļ¼ĖņŚÉ ŌĆóļÅÖņØ╝ĒĢ£ ļŹ░ņØ┤Ēä░ļĪ£ ņØĖņŗØņŗ£ņ╝£ ņżśņĢ╝ ĒĢ© (trim)
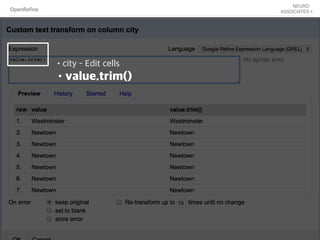
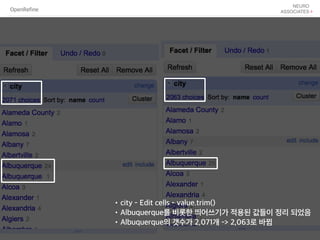
- 27. OpenRefine ŌĆócity - Edit cells ŌĆóvalue.trim()
- 28. OpenRefine ŌĆócity - Edit cells - value.trim() ŌĆóAlbuquerqueļź╝ ļ╣äļĪ»ĒĢ£ ļØäņ¢┤ņō░ĻĖ░Ļ░Ć ņĀüņÜ®ļÉ£ Ļ░ÆļōżņØ┤ ņĀĢļ”¼ ļÉśņŚłņØī ŌĆóAlbuquerqueņØś Ļ░»ņłśĻ░Ć 2,071Ļ░£ -> 2,063ļĪ£ ļ░öļĆ£
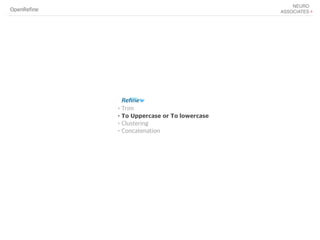
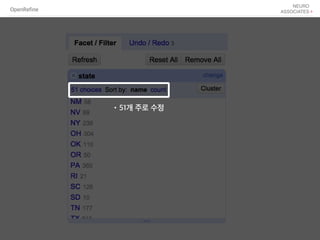
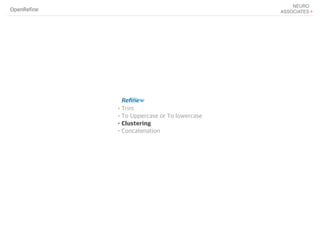
- 29. OpenRefine ŌĆóTrim ŌĆóTo Uppercase or To lowercase ŌĆóClustering ŌĆóConcatenation
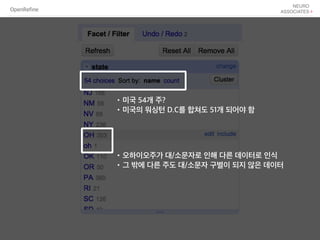
- 30. OpenRefine ŌĆóļ»ĖĻĄŁ 54Ļ░£ ņŻ╝? ŌĆóļ»ĖĻĄŁņØś ņøīņŗ▒Ēä┤ D.Cļź╝ ĒĢ®ņ│ÉļÅä 51Ļ░£ ļÉśņ¢┤ņĢ╝ ĒĢ© ŌĆóņśżĒĢśņØ┤ņśżņŻ╝Ļ░Ć ļīĆ/ņåīļ¼Ėņ×ÉļĪ£ ņØĖĒĢ┤ ļŗżļźĖ ļŹ░ņØ┤Ēä░ļĪ£ ņØĖņŗØ ŌĆóĻĘĖ ļ░¢ņŚÉ ļŗżļźĖ ņŻ╝ļÅä ļīĆ/ņåīļ¼Ėņ×É ĻĄ¼ļ│äņØ┤ ļÉśņ¦Ć ņĢŖņØĆ ļŹ░ņØ┤Ēä░
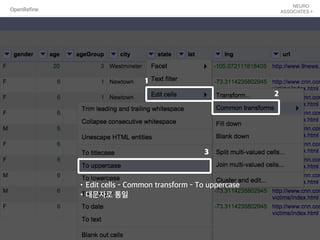
- 31. OpenRefine ŌĆóEdit cells - Common transform - To uppercase ŌĆóļīĆļ¼Ėņ×ÉļĪ£ ĒåĄņØ╝ 1 2 3
- 33. OpenRefine ŌĆóTrim ŌĆóTo Uppercase or To lowercase ŌĆóClustering ŌĆóConcatenation
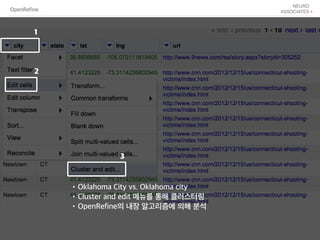
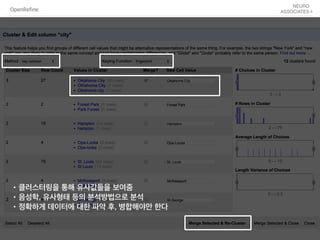
- 34. OpenRefine ŌĆóOklahoma City vs. Oklahoma city ŌĆóCluster and edit ļ®öļē┤ļź╝ ĒåĄĒĢ┤ Ēü┤ļ¤¼ņŖżĒä░ļ¦ü ŌĆóOpenRefineņØś ļé┤ņן ņĢīĻ│Āļ”¼ņ”śņŚÉ ņØśĒĢ┤ ļČäņäØ 1 2 3
- 35. OpenRefine ŌĆóĒü┤ļ¤¼ņŖżĒä░ļ¦üņØä ĒåĄĒĢ┤ ņ£Āņé¼Ļ░ÆļōżņØä ļ│┤ņŚ¼ņżī ŌĆóņØīņä▒ĒĢÖ, ņ£Āņé¼ĒśĢĒā£ ļō▒ņØś ļČäņäØļ░®ļ▓Ģņ£╝ļĪ£ ļČäņäØ ŌĆóņĀĢĒÖĢĒĢśĻ▓ī ļŹ░ņØ┤Ēä░ņŚÉ ļīĆĒĢ£ ĒīīņĢģ Ēøä, ļ│æĒĢ®ĒĢ┤ņĢ╝ļ¦ī ĒĢ£ļŗż
- 36. OpenRefine ŌĆóTrim ŌĆóTo Uppercase or To lowercase ŌĆóClustering ŌĆóConcatenation
- 37. OpenRefine ŌĆóļ»ĖĻĄŁ ņŻ╝ļ│ä ņ┤ØĻĖ░ņé¼Ļ▒┤ņłś ļ╣äĻĄÉ ŌĆó9ņ£ä ņĮ£ļ¤╝ļ▓äņŖżļŖö 72Ļ▒┤ ŌĆóĻ│╝ņŚ░ ĻĘĖļ¤┤Ļ╣ī?
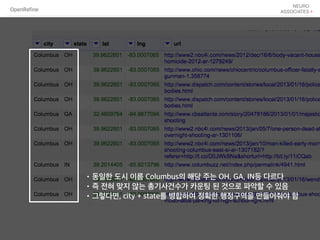
- 38. OpenRefine ŌĆóļÅÖņØ╝ĒĢ£ ļÅäņŗ£ ņØ┤ļ”ä ColumbusņØś ĒĢ┤ļŗ╣ ņŻ╝ļŖö OH, GA, INļō▒ ļŗżļź┤ļŗż ŌĆóņ”ē ņĀäĒśĆ ļ¦×ņ¦Ć ņĢŖļŖö ņ┤ØĻĖ░ņé¼Ļ▒┤ņłśĻ░Ć ņ╣┤ņÜ┤Ēīģ ļÉ£ Ļ▓āņ£╝ļĪ£ ĒīīņĢģĒĢĀ ņłś ņ׳ņØī ŌĆóĻĘĖļĀćļŗżļ®┤, city + stateļź╝ ļ│æĒĢ®ĒĢśņŚ¼ ņĀĢĒÖĢĒĢ£ Ē¢ēņĀĢĻĄ¼ņŚŁņØä ļ¦īļōżņ¢┤ņżśņĢ╝ ĒĢ©
- 39. OpenRefine ŌĆóCity - Edit cells - transform ŌĆóvalue + ŌĆ£,ŌĆØ + cells[ŌĆ£stateŌĆØ].value
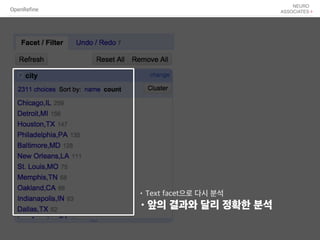
- 40. OpenRefine ŌĆóText facetņ£╝ļĪ£ ļŗżņŗ£ ļČäņäØ ŌĆóņĢ×ņØś Ļ▓░Ļ│╝ņÖĆ ļŗ¼ļ”¼ ņĀĢĒÖĢĒĢ£ ļČäņäØ
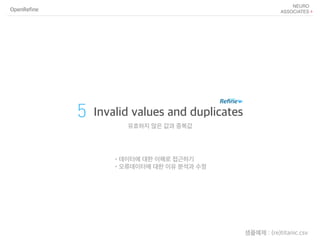
- 41. OpenRefine 5 Invalid values and duplicates ņ£ĀĒÜ©ĒĢśņ¦Ć ņĢŖņØĆ Ļ░ÆĻ│╝ ņżæļ│ĄĻ░Æ ņāśĒöīņśłņĀ£ : (re)titanic.csv ŌĆóļŹ░ņØ┤Ēä░ņŚÉ ļīĆĒĢ£ ņØ┤ĒĢ┤ļĪ£ ņĀæĻĘ╝ĒĢśĻĖ░ ŌĆóņśżļźśļŹ░ņØ┤Ēä░ņŚÉ ļīĆĒĢ£ ņØ┤ņ£Ā ļČäņäØĻ│╝ ņłśņĀĢ
- 42. OpenRefine ņāśĒöīņśłņĀ£ : (re)titanic.csv ŌĆóļŹ░ņØ┤Ēä░ņŚÉ ļīĆĒĢ£ ņØ┤ĒĢ┤ļĪ£ ņĀæĻĘ╝ĒĢśĻĖ░ ŌĆóņśżļźśļŹ░ņØ┤Ēä░ņŚÉ ļīĆĒĢ£ ņØ┤ņ£Ā ļČäņäØĻ│╝ ņłśņĀĢ
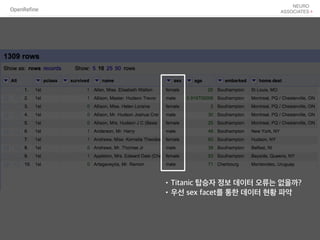
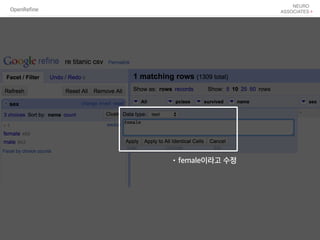
- 43. OpenRefine ŌĆóTitanic ĒāæņŖ╣ņ×É ņĀĢļ│┤ ļŹ░ņØ┤Ēä░ ņśżļźśļŖö ņŚåņØäĻ╣ī? ŌĆóņÜ░ņäĀ sex facetļź╝ ĒåĄĒĢ£ ļŹ░ņØ┤Ēä░ ĒśäĒÖ® ĒīīņĢģ
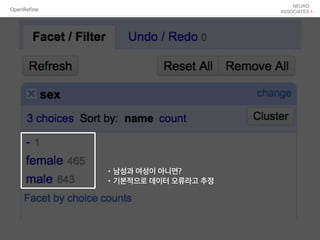
- 44. OpenRefine ŌĆóļé©ņä▒Ļ│╝ ņŚ¼ņä▒ņØ┤ ņĢäļŗłļ®┤? ŌĆóĻĖ░ļ│ĖņĀüņ£╝ļĪ£ ļŹ░ņØ┤Ēä░ ņśżļźśļØ╝Ļ│Ā ņČöņĀĢ
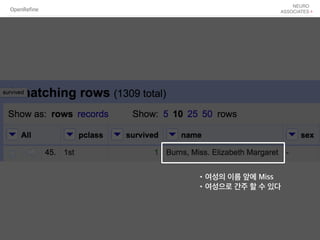
- 45. OpenRefine ŌĆóņŚ¼ņä▒ņØś ņØ┤ļ”ä ņĢ×ņŚÉ Miss ŌĆóņŚ¼ņä▒ņ£╝ļĪ£ Ļ░äņŻ╝ ĒĢĀ ņłś ņ׳ļŗż
- 47. OpenRefine ņāśĒöīņśłņĀ£ : (re)titanic.csv ŌĆóļŹ░ņØ┤Ēä░ņŚÉ ļīĆĒĢ£ ņØ┤ĒĢ┤ļĪ£ ņĀæĻĘ╝ĒĢśĻĖ░ ŌĆóņśżļźśļŹ░ņØ┤Ēä░ņŚÉ ļīĆĒĢ£ ņØ┤ņ£Ā ļČäņäØĻ│╝ ņłśņĀĢ
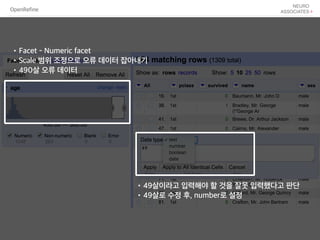
- 48. OpenRefine ŌĆóFacet - Numeric facet ŌĆóScale ļ▓öņ£ä ņĪ░ņĀĢņ£╝ļĪ£ ņśżļźś ļŹ░ņØ┤Ēä░ ņ×ĪņĢäļé┤ĻĖ░ ŌĆó490ņé┤ ņśżļźś ļŹ░ņØ┤Ēä░ ŌĆó49ņé┤ņØ┤ļØ╝Ļ│Ā ņ×ģļĀźĒĢ┤ņĢ╝ ĒĢĀ Ļ▓āņØä ņלļ¬╗ ņ×ģļĀźĒ¢łļŗżĻ│Ā ĒīÉļŗ© ŌĆó49ņé┤ļĪ£ ņłśņĀĢ Ēøä, numberļĪ£ ņäżņĀĢ
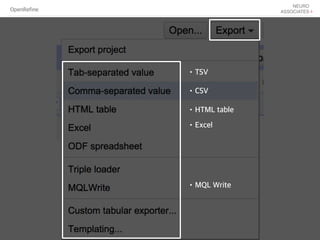
- 49. OpenRefine 6 Exporting a project ĒöäļĪ£ņĀØĒŖĖ ļé┤ļ│┤ļé┤ĻĖ░
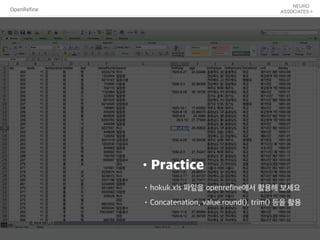
- 51. OpenRefine ŌĆóPractice ŌĆóhokuk.xls ĒīīņØ╝ņØä openrefineņŚÉņä£ ĒÖ£ņÜ®ĒĢ┤ ļ│┤ņäĖņÜö ŌĆóConcatenation, value.round(), trim() ļō▒ņØä ĒÖ£ņÜ®
- 52. OpenRefine