


More Related Content
What's hot (14)
Viewers also liked (8)
Similar to Future Forum 2013 - Ivana Capozza (20)


More from Friuli Future Forum (20)


Future Forum 2013 - Ivana Capozza
- 1. REPORT OCSE 2013 SULLŌĆÖAMBIENTE, IL PAESAGGIO, IL CLIMA Future Forum 8 novembre 2013 Udine Ivana Capozza Senior Economist, Environmental Performance Reviews OECD Environment Directorate
- 2. Sommario ŌĆó Che cosŌĆÖ├© la crescita verde ŌĆó Situazione dellŌĆÖambiente in Italia ŌĆó Opportunit├Ā per investimenti, innovazione, crescita e occupazione ŌĆó Le politiche per la crescita verde ŌĆó Riforma fiscale verde 2
- 3. Che cosŌĆÖ├© la crescita verde? UnŌĆÖoperazione di marketing? Una scusa per proteggere le imprese ŌĆ£verdiŌĆØ? NO! La crescita zero?
- 4. Che cosŌĆÖ├© la crescita verde? ŌĆó Promuovere crescita e sviluppo e, al contempo, garantire che i beni ambientali continuino a fornire le risorse e i servizi necessari al nostro benessere. ŌĆó No conflitto tra crescita economica e ambiente. ŌĆó Rendere operativi i principi dello sviluppo sostenibile. ŌĆó Abbiamo bisogno della crescita economica, meglio che sia VERDE!!!
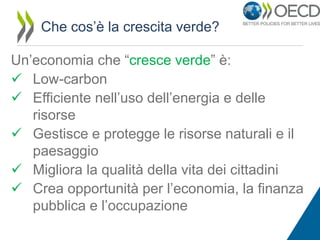
- 5. Che cosŌĆÖ├© la crescita verde? UnŌĆÖeconomia che ŌĆ£cresce verdeŌĆØ ├©: ’ā╝ Low-carbon ’ā╝ Efficiente nellŌĆÖuso dellŌĆÖenergia e delle risorse ’ā╝ Gestisce e protegge le risorse naturali e il paesaggio ’ā╝ Migliora la qualit├Ā della vita dei cittadini ’ā╝ Crea opportunit├Ā per lŌĆÖeconomia, la finanza pubblica e lŌĆÖoccupazione
- 6. E lŌĆÖItalia ŌĆ” sta crescendo verde?
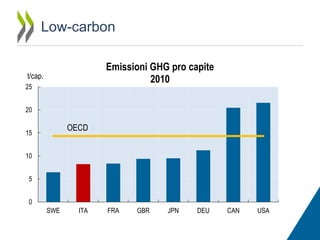
- 8. Low-carbon Emissioni GHG pro capite 2010 t/cap. 25 20 OECD 15 10 5 0 SWE ITA FRA GBR JPN DEU CAN USA
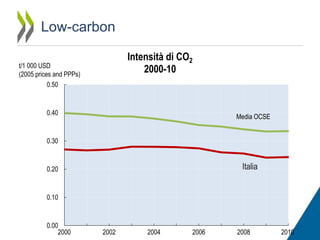
- 9. Low-carbon Intensit├Ā di CO2 2000-10 t/1 000 USD (2005 prices and PPPs) 0.50 0.40 Media OCSE 0.30 Italia 0.20 0.10 0.00 2000 2002 2004 2006 2008 2010
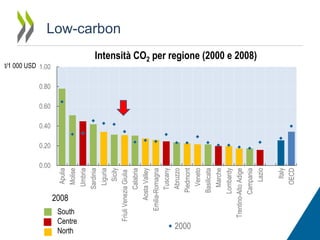
- 10. 0.00 2008 South Centre North t/1 000 USD 1.00 2000 Italy OECD Apulia Molise Umbria Sardinia Liguria Sicily Friuli Venezia Giulia Calabria Aosta Valley Emilia-Romagna Tuscany Abruzzo Piedmont Veneto Basilicata Marche Lombardy Trentino-Alto Adige Campania Lazio Low-carbon Intensit├Ā CO2 per regione (2000 e 2008) 0.80 0.60 0.40 0.20
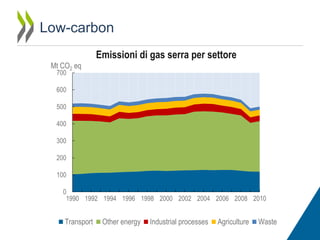
- 11. Low-carbon Emissioni di gas serra per settore Mt CO2 eq 700 600 500 400 300 200 100 0 1990 1992 1994 1996 1998 2000 2002 2004 2006 2008 2010 Transport Other energy Industrial processes Agriculture Waste
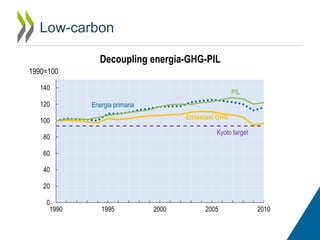
- 12. Low-carbon Decoupling energia-GHG-PIL 1990=100 140 120 PIL Energia primaria Emissioni GHG 100 Kyoto target 80 60 40 20 0 1990 1995 2000 2005 2010
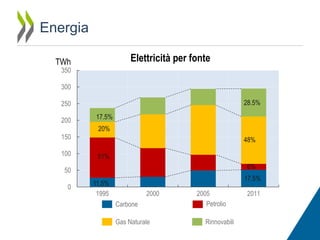
- 13. Energia Elettricit├Ā per fonte TWh 350 300 28.5% 250 200 17.5% 20% 150 100 48% 51% 6% 50 0 17.5% 11.5% 1995 2000 Carbone Gas Naturale 2005 Petrolio Rinnovabili 2011
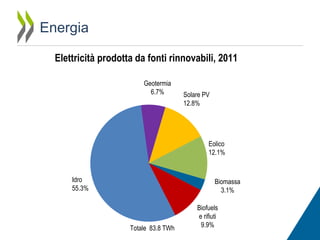
- 14. Energia Elettricit├Ā prodotta da fonti rinnovabili, 2011 Geotermia 6.7% Solare PV 12.8% Eolico 12.1% Idro 55.3% Biomassa 3.1% Totale 83.8 TWh Biofuels e rifiuti 9.9%
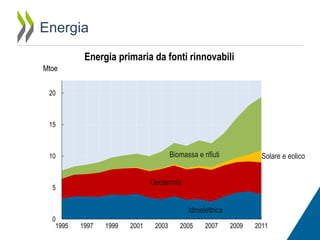
- 15. Energia Energia primaria da fonti rinnovabili Mtoe 20 15 Biomassa e rifiuti 10 Solare e eolico Geotermia 5 Idroelettrica 0 1995 1997 1999 2001 2003 2005 2007 2009 2011
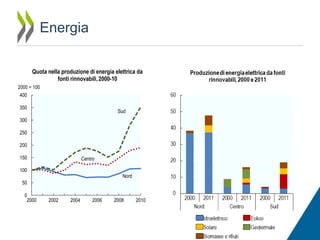
- 16. Energia Quota nella produzione di energia elettrica da fonti rinnovabili, 2000-10 2000 = 100 400 350 Sud 300 250 200 150 Centro 100 Nord 50 0 2000 2002 2004 2006 2008 2010
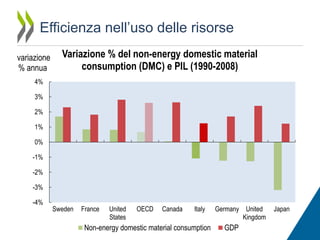
- 17. Efficienza nellŌĆÖuso delle risorse variazione % annua Variazione % del non-energy domestic material consumption (DMC) e PIL (1990-2008) 4% 3% 2% 1% 0% -1% -2% -3% -4% Sweden France United States OECD Canada Italy Non-energy domestic material consumption Germany United Kingdom GDP Japan
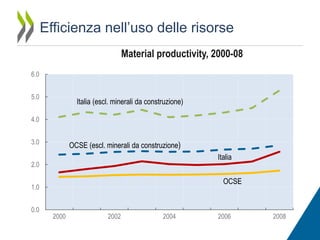
- 18. Efficienza nellŌĆÖuso delle risorse Material productivity, 2000-08 6.0 5.0 Italia (escl. minerali da construzione) 4.0 3.0 OCSE (escl. minerali da construzione) Italia 2.0 OCSE 1.0 0.0 2000 2002 2004 2006 2008
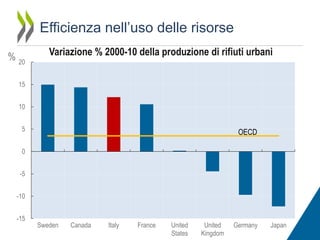
- 19. Efficienza nellŌĆÖuso delle risorse % 20 Variazione % 2000-10 della produzione di rifiuti urbani 15 10 5 OECD 0 -5 -10 -15 Sweden Canada Italy France United States United Kingdom Germany Japan
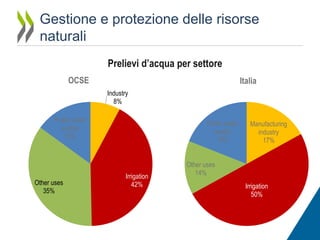
- 20. Gestione e protezione delle risorse naturali Prelievi dŌĆÖacqua per settore OCSE Italia Industry 8% Public water supply 15% Other uses 35% Public water supply 19% Irrigation 42% Manufacturing industry 17% Other uses 14% Irrigation 50%
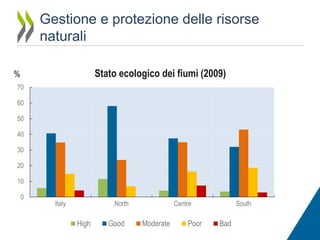
- 21. Gestione e protezione delle risorse naturali Stato ecologico dei fiumi (2009) % 70 60 50 40 30 20 10 0 Italy North High Good Centre Moderate Poor South Bad
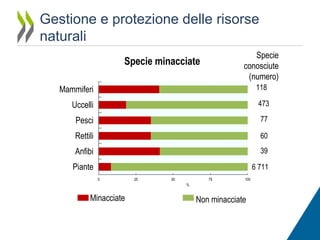
- 22. Gestione e protezione delle risorse naturali Specie conosciute (numero) Specie minacciate Mammiferi 118 Uccelli 473 Pesci 77 Rettili 60 Anfibi 39 Piante 6 711 0 25 50 75 100 % Minacciate Non minacciate
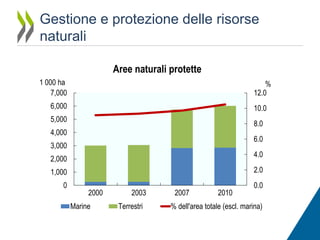
- 23. Gestione e protezione delle risorse naturali Aree naturali protette 1 000 ha 7,000 % 12.0 6,000 10.0 5,000 8.0 4,000 6.0 3,000 4.0 2,000 1,000 2.0 0 0.0 2000 Marine 2003 Terrestri 2007 2010 % dell'area totale (escl. marina)
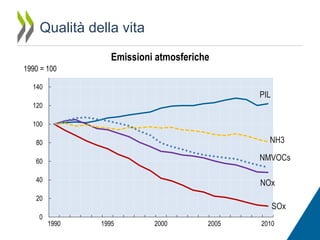
- 24. Qualit├Ā della vita Emissioni atmosferiche 1990 = 100 140 PIL 120 100 NH3 80 NMVOCs 60 40 NOx 20 0 SOx 1990 1995 2000 2005 2010
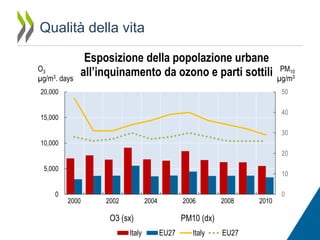
- 25. Qualit├Ā della vita O3 ┬Ąg/m3. days Esposizione della popolazione urbane allŌĆÖinquinamento da ozono e parti sottili 20,000 PM10 ┬Ąg/m3 50 40 15,000 30 10,000 20 5,000 0 10 2000 2002 2004 2006 O3 (sx) Italy 2008 PM10 (dx) EU27 Italy EU27 2010 0
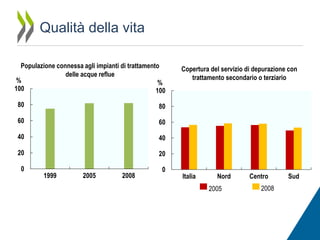
- 26. Qualit├Ā della vita Populazione connessa agli impianti di trattamento delle acque reflue % % 100 100 80 80 60 60 40 40 20 20 0 0 Copertura del servizio di depurazione con trattamento secondario o terziario 1999 2005 2008 Italia Nord 2005 Centro 2008 Sud
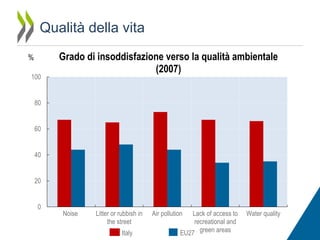
- 27. Qualit├Ā della vita % 100 Grado di insoddisfazione verso la qualit├Ā ambientale (2007) 80 60 40 20 0 Noise Litter or rubbish in the street Italy Air pollution Lack of access to recreational and EU27 green areas Water quality
- 28. Opportunit├Ā per economia e occupazione
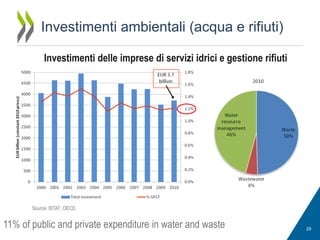
- 29. Investimenti ambientali (acqua e rifiuti) Investimenti delle imprese di servizi idrici e gestione rifiuti Source: ISTAT; OECD. 11% of public and private expenditure in water and waste 29
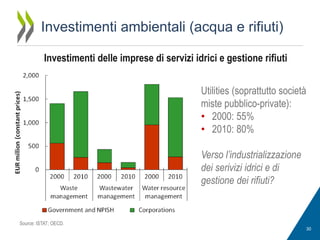
- 30. Investimenti ambientali (acqua e rifiuti) Investimenti delle imprese di servizi idrici e gestione rifiuti Utilities (soprattutto societ├Ā miste pubblico-private): ŌĆó 2000: 55% ŌĆó 2010: 80% Verso lŌĆÖindustrializzazione dei serivizi idrici e di gestione dei rifiuti? Source: ISTAT; OECD. 30
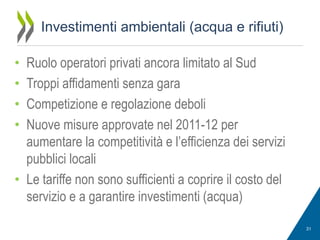
- 31. Investimenti ambientali (acqua e rifiuti) Ruolo operatori privati ancora limitato al Sud Troppi affidamenti senza gara Competizione e regolazione deboli Nuove misure approvate nel 2011-12 per aumentare la competitivit├Ā e lŌĆÖefficienza dei servizi pubblici locali ŌĆó Le tariffe non sono sufficienti a coprire il costo del servizio e a garantire investimenti (acqua) ŌĆó ŌĆó ŌĆó ŌĆó 31
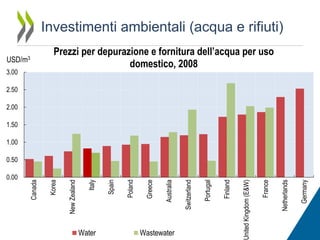
- 32. Investimenti ambientali (acqua e rifiuti) USD/m3 3.00 Prezzi per depurazione e fornitura dellŌĆÖacqua per uso domestico, 2008 2.50 2.00 1.50 1.00 Germany Netherlands France Finland Portugal Switzerland Australia Poland Greece Wastewater United Kingdom (E&W) Water Spain Italy New Zealand Korea 0.00 Canada 0.50
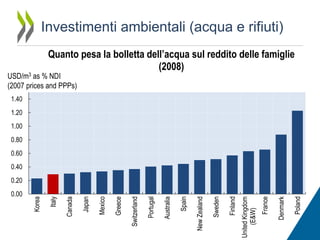
- 33. Investimenti ambientali (acqua e rifiuti) Quanto pesa la bolletta dellŌĆÖacqua sul reddito delle famiglie (2008) USD/m3 as % NDI (2007 prices and PPPs) 1.40 1.20 1.00 0.80 0.60 0.40 Poland Denmark France United Kingdom (E&W) Finland Sweden New Zealand Spain Australia Portugal Switzerland Greece Mexico Japan Canada Italy 0.00 Korea 0.20
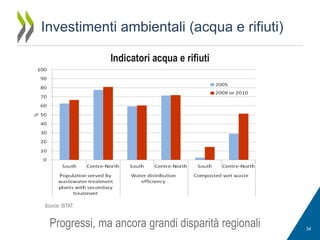
- 34. Investimenti ambientali (acqua e rifiuti) Indicatori acqua e rifiuti Source: ISTAT. Progressi, ma ancora grandi disparit├Ā regionali 34
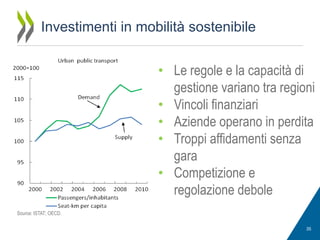
- 35. Investimenti in mobilit├Ā sostenibile ŌĆó Le regole e la capacit├Ā di gestione variano tra regioni ŌĆó Vincoli finanziari ŌĆó Aziende operano in perdita ŌĆó Troppi affidamenti senza gara ŌĆó Competizione e regolazione debole Source: ISTAT; OECD. 35
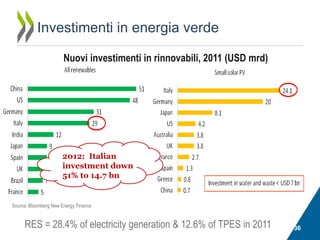
- 36. Investimenti in energia verde Nuovi investimenti in rinnovabili, 2011 (USD mrd) 2012: Italian investment down 51% to 14.7 bn Source: Bloomberg New Energy Finance RES = 28.4% of electricity generation & 12.6% of TPES in 2011 36
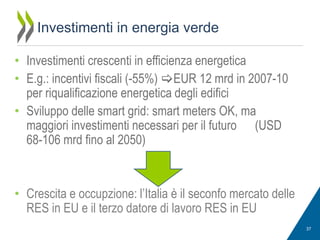
- 37. Investimenti in energia verde ŌĆó Investimenti crescenti in efficienza energetica ŌĆó E.g.: incentivi fiscali (-55%) ’üøEUR 12 mrd in 2007-10 per riqualificazione energetica degli edifici ŌĆó Sviluppo delle smart grid: smart meters OK, ma maggiori investimenti necessari per il futuro (USD 68-106 mrd fino al 2050) ŌĆó Crescita e occupzione: lŌĆÖItalia ├© il seconfo mercato delle RES in EU e il terzo datore di lavoro RES in EU 37
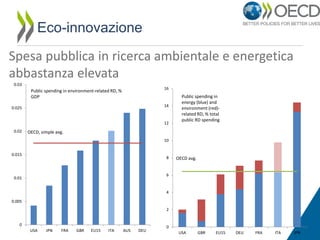
- 38. Eco-innovazione Spesa pubblica in ricerca ambientale e energetica abbastanza elevata 0.03 16 Public spending in environment-related RD, % GDP 14 0.025 12 0.02 Public spending in energy (blue) and environment (red)related RD, % total public RD spending OECD, simple avg. 10 0.015 8 OECD avg. 6 0.01 4 0.005 2 0 USA JPN FRA GBR EU15 ITA AUS DEU 0 USA GBR EU15 DEU FRA ITA JPN
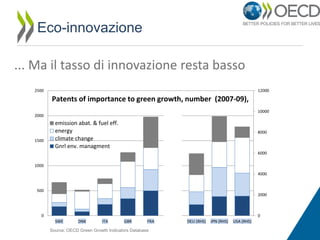
- 39. Eco-innovazione ... Ma il tasso di innovazione resta basso 2500 12000 Patents of importance to green growth, number (2007-09), 10000 2000 1500 emission abat. & fuel eff. energy climate change Gnrl env. managment 8000 6000 1000 4000 500 2000 0 0 SWE DNK ITA GBR FRA Source: OECD Green Growth Indicators Database DEU (RHS) JPN (RHS) USA (RHS)
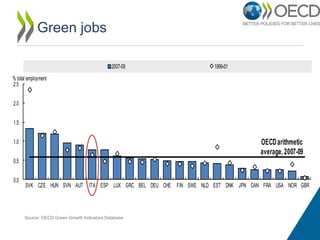
- 40. Green jobs 2007-09 1999-01 % total employment 2.5 2.0 1.5 OECD arithmetic average, 2007-09 1.0 0.5 0.0 SVK CZE HUN SVN AUT ITA ESP LUX GRC BEL DEU CHE FIN SWE NLD EST DNK JPN CAN FRA USA NOR GBR Source: OECD Green Growth Indicators Database
- 41. Quali politiche per la crescita verde?
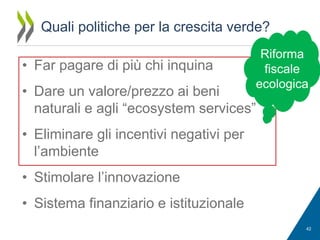
- 42. Quali politiche per la crescita verde? ŌĆó Far pagare di pi├╣ chi inquina Riforma fiscale ecologica ŌĆó Dare un valore/prezzo ai beni naturali e agli ŌĆ£ecosystem servicesŌĆØ ŌĆó Eliminare gli incentivi negativi per lŌĆÖambiente ŌĆó Stimolare lŌĆÖinnovazione ŌĆó Sistema finanziario e istituzionale 42
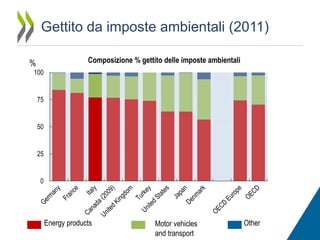
- 43. Gettito da imposte ambientali (2011) Composizione % gettito delle imposte ambientali % 100 75 50 25 0 Energy products Motor vehicles and transport Other
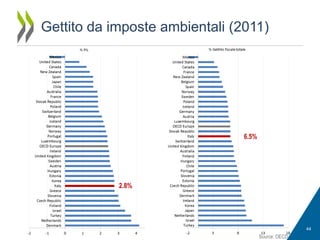
- 44. Gettito da imposte ambientali (2011) 6.5% 2.8% 44 Source: OECD.
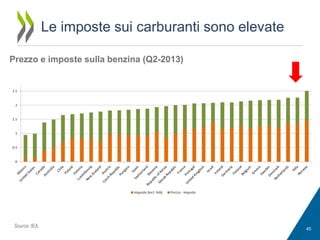
- 45. Le imposte sui carburanti sono elevate Prezzo e imposte sulla benzina (Q2-2013) Source: IEA. 45
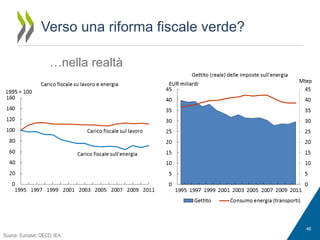
- 46. Verso una riforma fiscale verde? ŌĆ”nella realt├Ā In un mondo idealeŌĆ” 46 Source: Eurostat; OECD: IEA.
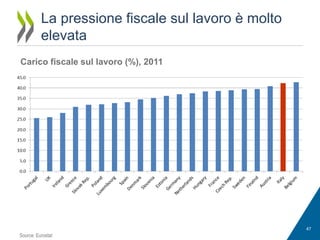
- 47. La pressione fiscale sul lavoro ├© molto elevata Carico fiscale sul lavoro (%), 2011 47 Source: Eurostat
- 48. Una riforma fiscale ŌĆ£verdeŌĆØ in Italia (1) ŌĆó Riforma fiscale ŌĆ£verdeŌĆØ: ŌĆō Usare pi├╣ imposte indirette sulle attivit├Ā negative per lŌĆÖambiente ŌĆō Eliminare gli incentivi/sussidi negativi per lŌĆÖambiente ŌĆó Gettito potenziale: 10-11% del gettito fiscale totale nel 2015 ŌĆō Consolidamento dei conti pubblici ŌĆō Ridurre le imposte che disincentivano la crescita economica ŌĆó Esperienze internazionali positive 48
- 49. Una riforma fiscale ŌĆ£verdeŌĆØ in Italia (2) ŌĆó Eliminare le esenzioni dalle imposte su energia e trasporti: EUR 3.7 miliardi (0.2% del PIL) 49
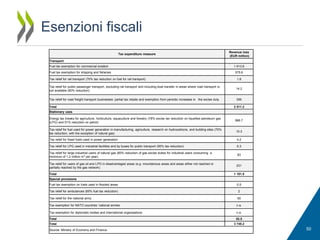
- 50. Esenzioni fiscali Tax expenditure measure Revenue loss (EUR million) Transport Fuel tax exemption for commercial aviation Fuel tax exemption for shipping and fisheries 1 613.6 575.6 Tax relief for rail transport (70% tax reduction on fuel for rail transport) 1.8 Tax relief for public passenger transport, excluding rail transport and including boat transfer in areas where road transport is not available (60% reduction) 14.2 Tax relief for road freight transport businesses: partial tax rebate and exemption from periodic increases in the excise duty 306 Total 2 511.2 Stationary uses Energy tax breaks for agriculture, horticulture, aquaculture and forestry (78% excise tax reduction on liquefied petroleum gas (LPG) and 51% reduction on petrol) 866.7 Tax relief for fuel used for power generation in manufacturing, agriculture, research on hydrocarbons, and building sites (70% tax reduction, with the exception of natural gas) 10.3 Tax relief for fossil fuels used in power generation 4.2 Tax relief for LPG used in industrial facilities and by buses for public transport (90% tax reduction) 6.3 Tax relief for large industrial users of natural gas (60% reduction of gas excise duties for industrial users consuming a minimum of 1.2 million m3 per year) 63 Tax relief for users of gas oil and LPG in disadvantaged areas (e.g. mountainous areas and areas either not reached or partially reached by the gas network) 231 Total 1 181.5 Special provisions Fuel tax exemption on fuels used in flooded areas 0.5 Tax relief for ambulances (60% fuel tax reduction) 2 Tax relief for the national army 50 Tax exemption for NATO countriesŌĆÖ national armies n.a. Tax exemption for diplomatic bodies and international organisations n.a. Total 52.5 Total 3 745.2 Source: Ministry of Economy and Finance. 50
- 51. Una riforma fiscale ŌĆ£verdeŌĆØ in Italia (2) ŌĆó Eliminare le esenzioni dalle imposte su energia e trasporti: EUR 3.7 miliardi (0.2% del PIL) ŌĆó Rimodulare le accise sui carburanti per meglio incorporare le esternalit├Ā ambientali ŌĆō Le imposte sui carburanti generano diversi ŌĆ£carbon pricesŌĆØ ŌĆō E.g.: lŌĆÖaccisa sul diesel ├© del 23% pi├╣ bassa di quella sulla benzina 51
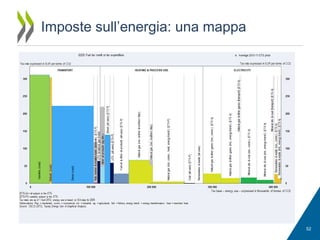
- 52. Imposte sullŌĆÖenergia: una mappa 52
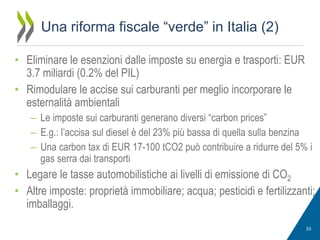
- 53. Una riforma fiscale ŌĆ£verdeŌĆØ in Italia (2) ŌĆó Eliminare le esenzioni dalle imposte su energia e trasporti: EUR 3.7 miliardi (0.2% del PIL) ŌĆó Rimodulare le accise sui carburanti per meglio incorporare le esternalit├Ā ambientali ŌĆō Le imposte sui carburanti generano diversi ŌĆ£carbon pricesŌĆØ ŌĆō E.g.: lŌĆÖaccisa sul diesel ├© del 23% pi├╣ bassa di quella sulla benzina ŌĆō Una carbon tax di EUR 17-100 tCO2 pu├▓ contribuire a ridurre del 5% i gas serra dai transporti ŌĆó Legare le tasse automobilistiche ai livelli di emissione di CO2 ŌĆó Altre imposte: propriet├Ā immobiliare; acqua; pesticidi e fertilizzanti; imballaggi. 53
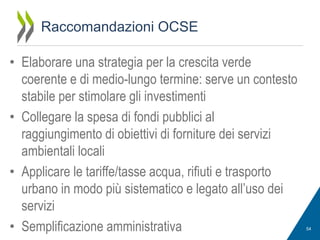
- 54. Raccomandazioni OCSE ŌĆó Elaborare una strategia per la crescita verde coerente e di medio-lungo termine: serve un contesto stabile per stimolare gli investimenti ŌĆó Collegare la spesa di fondi pubblici al raggiungimento di obiettivi di forniture dei servizi ambientali locali ŌĆó Applicare le tariffe/tasse acqua, rifiuti e trasporto urbano in modo pi├╣ sistematico e legato allŌĆÖuso dei servizi ŌĆó Semplificazione amministrativa 54
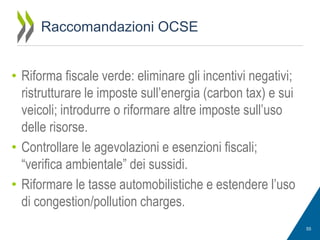
- 55. Raccomandazioni OCSE ŌĆó Riforma fiscale verde: eliminare gli incentivi negativi; ristrutturare le imposte sullŌĆÖenergia (carbon tax) e sui veicoli; introdurre o riformare altre imposte sullŌĆÖuso delle risorse. ŌĆó Controllare le agevolazioni e esenzioni fiscali; ŌĆ£verifica ambientaleŌĆØ dei sussidi. ŌĆó Riformare le tasse automobilistiche e estendere lŌĆÖuso di congestion/pollution charges. 55