ベイズモデリングによる第2种信号検出モデルの表现
Download as PPTX, PDF4 likes4,185 views

第3回ベイズ塾WS(6/30)@専修大学での発表資料です。 2018.11.28追記 コメントでスライドの間違いについてご指摘いただきました。 再アップロードはできなくなっておりましたので,以下のように読み替えていただければと思います。 [スライド11] Meta-d'は第1種課題の成績によって調整された第2種課題の弁別力である → Meta-d'は,等分散信号検出モデルを仮定した場合に、第二種課題の成績をもとに第一種課題の成績を推定した指標である


![[R勉強会][データマイニング] R言語による時系列分析](https://cdn.slidesharecdn.com/ss_thumbnails/r-100423232629-phpapp01-thumbnail.jpg?width=560&fit=bounds)


More Related Content
What's hot (20)
More from Takashi Yamane (14)


ベイズモデリングによる第2种信号検出モデルの表现
- 1. ベイズモデリングによる 第2種信号検出モデルの表現 2018.06.30 広島ベイズ塾WS3rd 『心理学者のためのベイズ統計学:モデリングの実際と,モデル選択?評価』 教育心理学への実践 川崎医療福祉大学 医療福祉学部 臨床心理学科 山根 嵩史
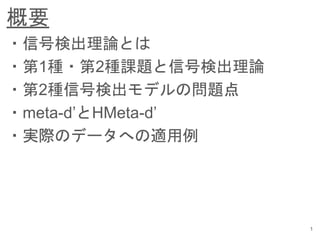
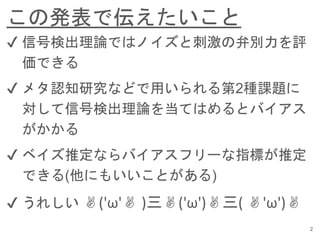
- 3. この発表で伝えたいこと 2 ?? 信号検出理論ではノイズと刺激の弁別力を評 価できる ?? メタ認知研究などで用いられる第2種課題に 対して信号検出理論を当てはめるとバイアス がかかる ?? ベイズ推定ならバイアスフリーな指標が推定 できる(他にもいいことがある) ?? うれしい ?('ω'? )三?('ω')?三( ?'ω')?
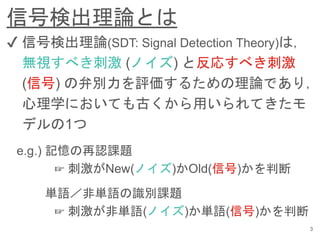
- 4. 信号検出理論とは 3 ?? 信号検出理論(SDT: Signal Detection Theory)は, 無視すべき刺激 (ノイズ) と反応すべき刺激 (信号) の弁別力を評価するための理論であり, 心理学においても古くから用いられてきたモ デルの1つ e.g.) 記憶の再認課題 ? 刺激がNew(ノイズ)かOld(信号)かを判断 単語/非単語の識別課題 ? 刺激が非単語(ノイズ)か単語(信号)かを判断
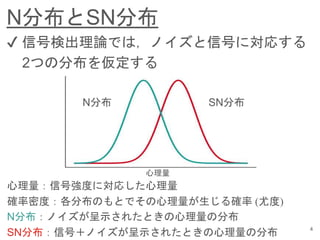
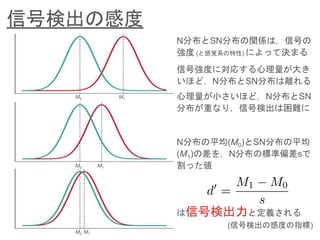
- 6. 信号検出の感度 N分布とSN分布の関係は,信号の 強度 (と感覚系の特性) によって決まる M0 M1 M0 M1 M0 M1 信号強度に対応する心理量が大き いほど,N分布とSN分布は離れる N分布の平均(M0)とSN分布の平均 (M1)の差を,N分布の標準偏差sで 割った値 は信号検出力と定義される (信号検出の感度の指標) 心理量が小さいほど,N分布とSN 分布が重なり,信号検出は困難に
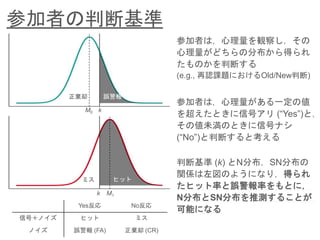
- 7. 参加者の判断基準 参加者は,心理量を観察し,その 心理量がどちらの分布から得られ たものかを判断する (e.g., 再認課題におけるOld/New判断) 参加者は,心理量がある一定の値 を超えたときに信号アリ (“Yes”)と, その値未満のときに信号ナシ (“No”)と判断すると考える M0 M1 k k 正棄却 誤警報 ミス ヒット 判断基準 (k) とN分布,SN分布の 関係は左図のようになり,得られ たヒット率と誤警報率をもとに, N分布とSN分布を推測することが 可能になる Yes反応 No反応 信号+ノイズ ヒット ミス ノイズ 誤警報 (FA) 正棄却 (CR)
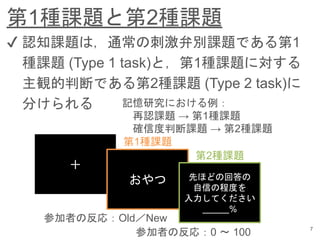
- 8. 第1種課題と第2種課題 7 ?? 認知課題は,通常の刺激弁別課題である第1 種課題 (Type 1 task)と,第1種課題に対する 主観的判断である第2種課題 (Type 2 task)に 分けられる 記憶研究における例: 再認課題 → 第1種課題 確信度判断課題 → 第2種課題 + おやつ 先ほどの回答の 自信の程度を 入力してください % 第1種課題 第2種課題 参加者の反応:Old/New 参加者の反応:0 ? 100
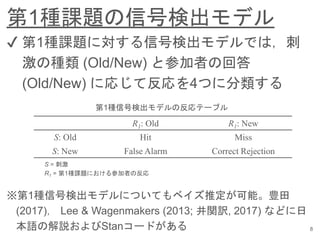
- 9. 第1種課題の信号検出モデル 8 ?? 第1種課題に対する信号検出モデルでは,刺 激の種類 (Old/New) と参加者の回答 (Old/New) に応じて反応を4つに分類する R1: Old R1: New S: Old Hit Miss S: New False Alarm Correct Rejection 第1種信号検出モデルの反応テーブル ※第1種信号検出モデルについてもベイズ推定が可能。豊田 (2017), Lee & Wagenmakers (2013; 井関訳, 2017) などに日 本語の解説およびStanコードがある S = 刺激 R1 = 第1種課題における参加者の反応
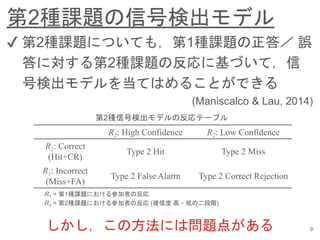
- 10. 第2種課題の信号検出モデル 9 ?? 第2種課題についても,第1種課題の正答/ 誤 答に対する第2種課題の反応に基づいて,信 号検出モデルを当てはめることができる (Maniscalco & Lau, 2014) R2: High Confidence R2: Low Confidence R1: Correct (Hit+CR) Type 2 Hit Type 2 Miss R1: Incorrect (Miss+FA) Type 2 False Alarm Type 2 Correct Rejection 第2種信号検出モデルの反応テーブル しかし,この方法には問題点がある R1 = 第1種課題における参加者の反応 R2 = 第2種課題における参加者の反応 (確信度 高?低の二段階)
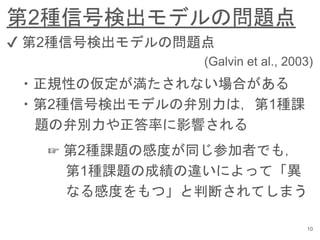
- 11. 第2種信号検出モデルの問題点 10 ?? 第2種信号検出モデルの問題点 (Galvin et al., 2003) ?正規性の仮定が満たされない場合がある ?第2種信号検出モデルの弁別力は,第1種課 題の弁別力や正答率に影響される ? 第2種課題の感度が同じ参加者でも, 第1種課題の成績の違いによって「異 なる感度をもつ」と判断されてしまう
- 12. Meta-d’とHMeta-d’ 11 ?? バイアスのない第2種課題の信号検出力の指 標として,Meta-d’が提案されている (Maniscalco & Lau, 2012) ?? Meta-d’は第1種課題の成績によって調整され た第2種課題の弁別力である (草薙, 2017) ?? さらに,ベイズ推定による階層的Meta-d’の推 定 (HMeta-d’) も提案されている (Fleming, 2017)
- 13. 第2種課題へのベイズアプローチ 12 ?? 第2種課題に対するベイズアプローチの利点 (Fleming, 2017) 1. 点推定ではないので,meta-d’の推定に含まれる不 確実性を評価できる 2. 階層ベイズアプローチを用いることで,参加者の 情報を潰さずに群間比較が可能 3. 度数が0のセルがあっても推定できる (補正の必要 がない) 4. グループレベルの仮説について自然に解釈するこ とができる 2, 3は心理実験において特にうれしい
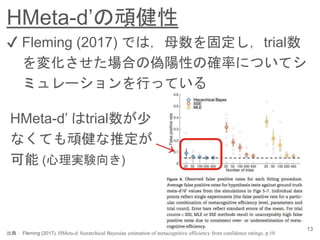
- 14. 13 ?? Fleming (2017) では,母数を固定し,trial数 を変化させた場合の偽陽性の確率についてシ ミュレーションを行っている HMeta-d’の頑健性 HMeta-d’ はtrial数が少 なくても頑健な推定が 可能 (心理実験向き) 出典: Fleming (2017). HMeta-d: hierarchical Bayesian estimation of metacognitive efficiency from confidence ratings. p.10
- 15. Meta-d’およびHMeta-d’の実装 14 ?? Meta-d’ (最尤法) については,Maniscalco & Lau (2014) のMatLabコード が利用可能 ?? また,Rのパッケージ“metaSDT”もある (https://github.com/craddm/metaSDT) ?? HMeta-d’についてはFleming (2017)に, JAGSによる推定を行うMatLabコードが公開 されている (非階層的なMeta-d’もベイズ推定 可能)
- 17. ベイズ推定によるHMeta-d’の推定 16 ?? 各学習フェーズにおける確信度判断の弁別力 について検討するため,ベイズ推定による HMeta-d’を推定 ?? HMeta-d’なら,正答率の影響を調整した確信 度判断の弁別力を評価できる ? 問題点①をクリア ?? ベイズ推定なら,度数が0のセルがあっても 計算が可能 (最尤法のMeta-d’のコードは走らない) ? 問題点②をクリア
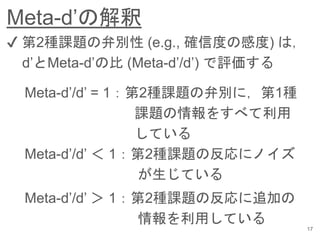
- 18. Meta-d’の解釈 17 ?? 第2種課題の弁別性 (e.g., 確信度の感度) は, d’とMeta-d’の比 (Meta-d’/d’) で評価する Meta-d’/d’ = 1:第2種課題の弁別に,第1種 課題の情報をすべて利用 している Meta-d’/d’ < 1:第2種課題の反応にノイズ が生じている Meta-d’/d’ > 1:第2種課題の反応に追加の 情報を利用している
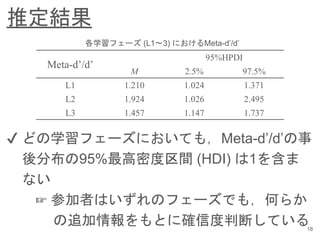
- 19. 推定結果 18 Meta-d’/d’ 95%HPDI M 2.5% 97.5% L1 1.210 1.024 1.371 L2 1.924 1.026 2.495 L3 1.457 1.147 1.737 各学習フェーズ (L1?3) におけるMeta-d’/d’ ?? どの学習フェーズにおいても,Meta-d’/d’の事 後分布の95%最高密度区間 (HDI) は1を含ま ない ? 参加者はいずれのフェーズでも,何らか の追加情報をもとに確信度判断している
- 20. 信号検出理論の応用可能性 19 ?? 信号検出理論は“ノイズ”と“信号”の定義次第で 様々な心理現象の測定に応用できる ?? 第2種信号検出モデルも,これらの心理現象 に対する意思決定やメタ認知的な判断の感度 やバイアスの検討に有用である ?? 今後,こうした手法が市民権を得ていくと思 われる (草薙, 2018)
- 21. おわりに 20 ?? ベイズモデリングによって,第2種課題の信 号検出力の指標を正しく推定可能 ?? ベイズモデリングは既存の 認知モデルを表現 し,拡張することもできる ?? いきなりゼロからモデルを考えるのはちょっ と...という方は,既存のモデルのベイズによ る分析からトライしてみるのはいかがでしょ うか
- 22. 引用?参考文献 Fleming, S. M. (2017). HMeta-d: hierarchical Bayesian estimation of metacognitive efficiency from confidence ratings. Neuroscience of Consciousness, 1, 1-14. Fleming, S. M., & Lau, H. C. (2014). How to measure metacognition. Frontiers in human neuroscience, 8, 1-9. Galvin, S. J., Podd, J. V., Drga, V., & Whitmore, J. (2003). Type 2 tasks in the theory of signal detectability: Discrimination between correct and incorrect decisions. Psychonomic Bulletin & Review, 10, 843-876. 草薙邦広 (2018). 外国語教育研究における第二種信号検出モデル: 基本の理解とベイジ アンモデリング 広島外国語教育研究, 21, 169-185. Lee, M.D., & Wagenmakers, E. J. (2013). Bayesian Cognitive Modeling: A Practical Course. Cambridge: Cambridge University Press. (リー, M. D. & ワーゲンメイカーズ, E. J. 井関龍太(訳) 岡田謙介(解説) (2017). 『ベイズ統計で実践モデリング 認知モデルのトレーニング』 北大路書房) Maniscalco, B., & Lau, H. C. (2014). Signal detection theory analysis of Type 1 and Type 2 data: Meta-d’, response-specific Meta-d’, and the unequal variance SDT model. In: Fleming, S. M., Frith, C. D. (Eds), The Cognitive Neuroscience of Metacognition. Berlin Heidelberg: Springer, 2014. 三好清文 (2016). 再認記憶データモデリング 心理学評論, 59, 367-386. Pallier, C. (2002). Computing discriminability and bias with the R software (http://www.pallier. org/pdfs/aprime.pdf) 豊田秀樹 (2017). 『実践ベイズモデリング:解析技法と認知モデル』東京:朝倉書店.